37-38 - Electrical Power and Component I-V Characteristics
This lesson connects two things that often get taught separately: the rate at which a component transfers energy, and the shape of its current-potential difference graph. You will use and derive the electrical power equations, then read I-V graphs for ohmic conductors, filament bulbs, thermistors and diodes. The thread running through the lesson is simple: a graph shape is evidence for what is happening to resistance inside the component.
Power starts with a charge
Imagine one coulomb of charge passing through a lamp. If the potential difference across the lamp is , each coulomb transfers of energy to the lamp because
.
Current then tells you how many coulombs pass each second. If the current is , then passes each second. So the lamp receives
That is power. Electrical power is the rate of energy transfer:
Electrical power
| Quantity | Meaning | Unit |
|---|---|---|
| power transferred by the component | watt, | |
| potential difference across the component | volt, | |
| current through the component | ampere, | |
| energy transferred (work done) in time | joule, |
The unit check is a good way to keep the model alive:
So current is not "energy flowing". Current is charge per second. Potential difference is energy per charge. Power appears when those two ideas meet.
If the component runs at constant p.d. and current for a time , the energy transferred is
.
Edexcel writes the energy transferred or work done as , measured in joules. Do not confuse that symbol with the unit watt, written .
If power changes during the interval, use the area under a power–time graph, or add for short intervals; one instantaneous value multiplied by the whole time is not generally the total energy. The equation assumes the operating values remain constant during .
Choosing power equations
The equation is the starting point. The related equations come from combining it with the resistance relationship
.
If current and resistance are the useful quantities, replace in :
.
If potential difference and resistance are the useful quantities, replace in :
.
Power in terms of resistance
: resistance at the operating point (Ω), with and the current through and p.d. across the same component.
This is what Edexcel means by "derive" here: show the equation route, not just quote the final relationship.
The decision point is not "which equation do I remember?" It is "which quantities are fixed or known?"
| Situation | Efficient relationship | Reason |
|---|---|---|
| You know and | Direct rate of energy transfer | |
| You know and | Avoid calculating first | |
| You know and | Avoid calculating first |
For non-ohmic components, may change as the component heats or as the p.d. changes. In that case, use the operating values at that moment, not a cold resistance measured before the component was switched on.
A lamp running from a supply
A small lamp operates at with a current of for .
The known quantities are , and , so use for the rate and for the energy.
The lamp transfers energy at about .
Convert the time:
.
To two significant figures, the energy transferred is .
The answer is not just the number. The physical interpretation is that the lamp transfers about of electrical energy into light and thermal energy during the three minutes.
I-V graphs as resistance stories
A current-potential difference graph usually has potential difference on the horizontal axis and current on the vertical axis. Always check the axes, because a p.d.-current graph has the axes swapped.
Each point on an I-V graph is an operating condition for the component. The resistance at that point is found from
.
For an ohmic conductor at constant temperature, is directly proportional to . The I-V graph is a straight line through the origin, and the gradient is
.
So a steeper straight-line I-V graph means a smaller resistance. That shortcut is safe for an ohmic straight line.
For a curved I-V graph, be more careful. The resistance at a point is still , using the coordinates of that point. The tangent gradient tells you how quickly current is changing with p.d. at that instant; it is not automatically the component resistance.
The resistance at any point on an I-V graph is from that point's coordinates. Only for a straight line through the origin does the gradient equal .
Reading two points on a filament lamp graph
Suppose a filament lamp has these two operating points:
| Potential difference across lamp | Current through lamp |
|---|---|
At :
.
At :
.
The resistance has increased. The physical reason is that the filament is hotter at the larger p.d.; the metal ions vibrate more, so charge carriers collide with the lattice more often. That is why the graph curves and becomes less steep at larger positive or negative p.d.
The power at the second point is
.
So the same graph point can tell you resistance and power, provided you read the coordinates carefully.
Component signatures
When Edexcel asks you to sketch, recognise or interpret I-V graphs, the mark usually comes from matching the shape to the physics. The axes and origin matter, but the reason for the shape matters just as much.
[DIAGRAM: asset_name: Four component I–V characteristics; asset_slug: 9ph0_iv_signatures; recommended_method: deterministic; description: Four labelled qualitative I-V sketches: straight ohmic line, symmetric filament curve with reducing slope, symmetric NTC self-heating curve with increasing slope, and asymmetric diode negligible reverse current followed by steep forward current.]
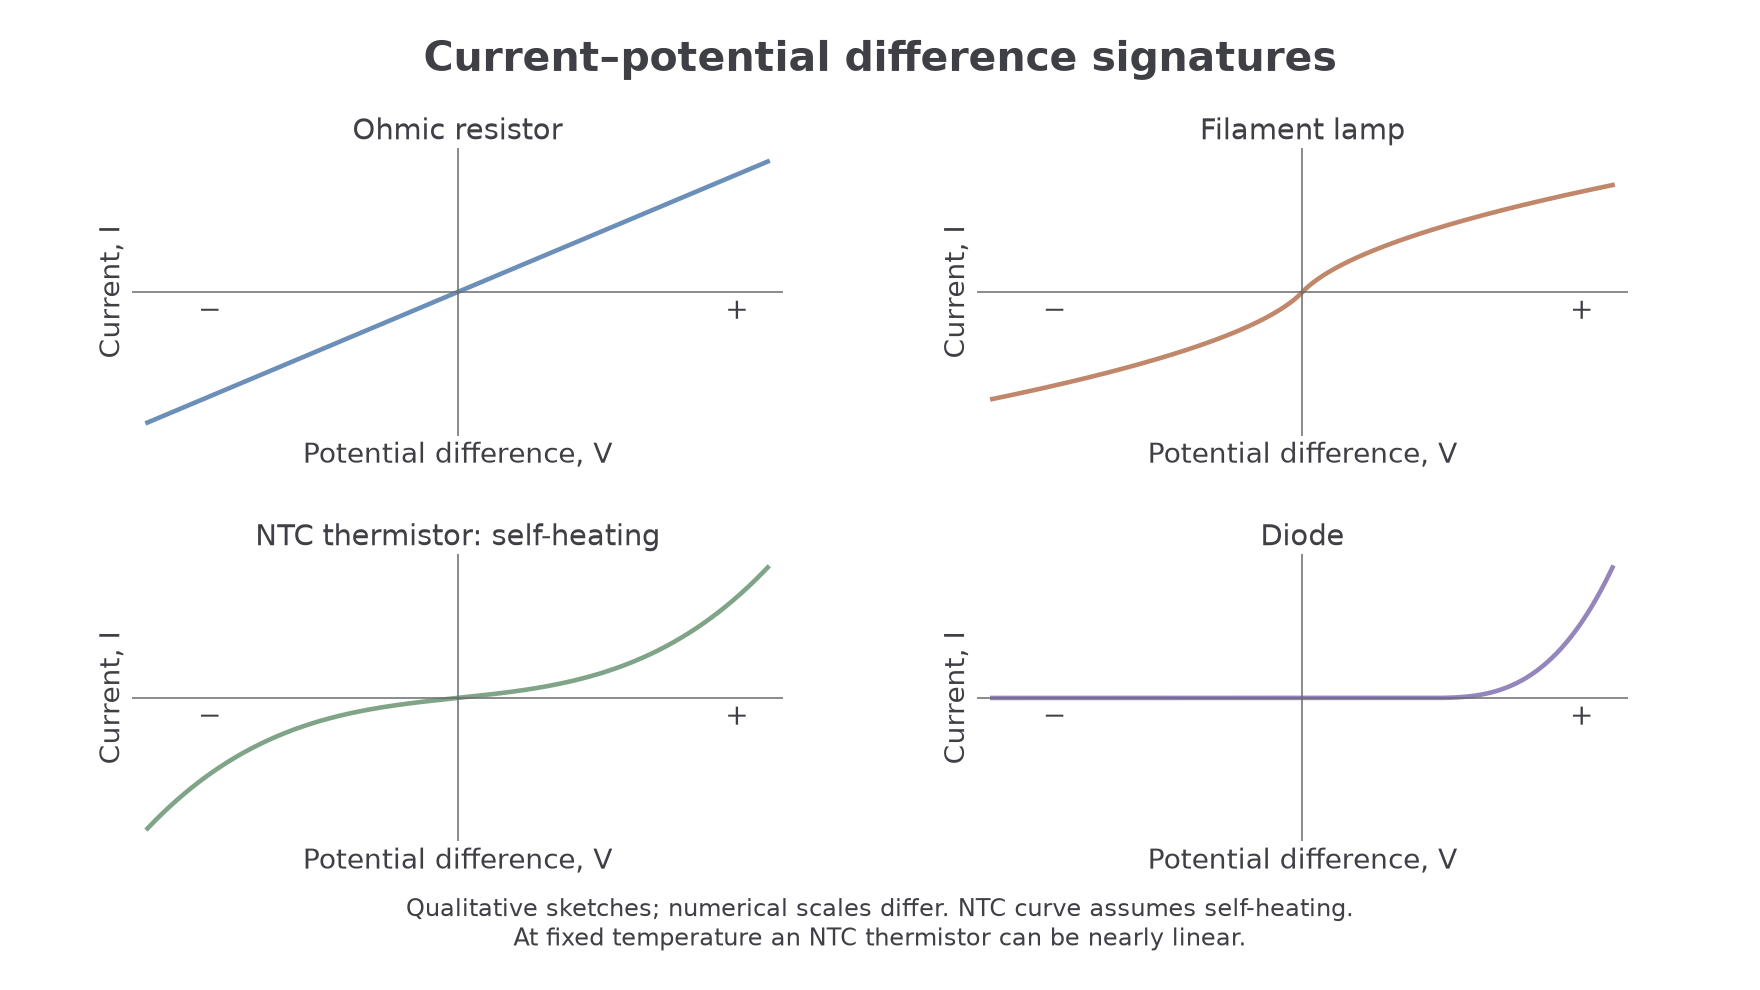
| Component | I-V signature | Physical reason |
|---|---|---|
| Ohmic conductor at constant temperature | Straight line through the origin, same behaviour for positive and negative p.d. | Resistance is constant, so is directly proportional to . |
| Filament bulb | Curve through the origin that becomes less steep as the size of increases; roughly symmetric for positive and negative p.d. | Larger current heats the filament; higher temperature increases metal resistance. |
| NTC thermistor | For the usual school/A-level NTC thermistor, the current can rise more rapidly as self-heating increases; externally warming it also gives a larger current for the same p.d. | Higher temperature decreases resistance. If the thermistor is kept at a fixed temperature and self-heating is tiny, it can look almost ohmic over a small range. |
| Diode | Very small current in reverse bias; little current at first in forward bias, then a rapid rise. The graph is not symmetric. | A diode conducts much more easily in one direction than the other. |
Notice the contrast between a filament bulb and an NTC thermistor. Both can heat up as current increases, but they curve in opposite physical directions because their resistance responds differently to temperature.
For a filament bulb:
.
For a usual NTC thermistor:
.
A diode is different again. It is not mainly a "heating changes resistance" story at this level. Its graph is a polarity story: forward bias allows current after the diode starts conducting strongly; reverse bias gives almost no current in ordinary operation.
Getting an I-V characteristic
Although this is not a core practical, Edexcel can still ask practical and graph questions about component characteristics.
[DIAGRAM: asset_name: Diode I–V measurement circuit; asset_slug: 9ph0_diode_measurement; recommended_method: deterministic; description: Forward-biased diode with series protective resistor and ammeter, voltmeter across the diode only and a variable low-voltage DC supply. Switch off to reverse the supply or diode for reverse-bias readings.]
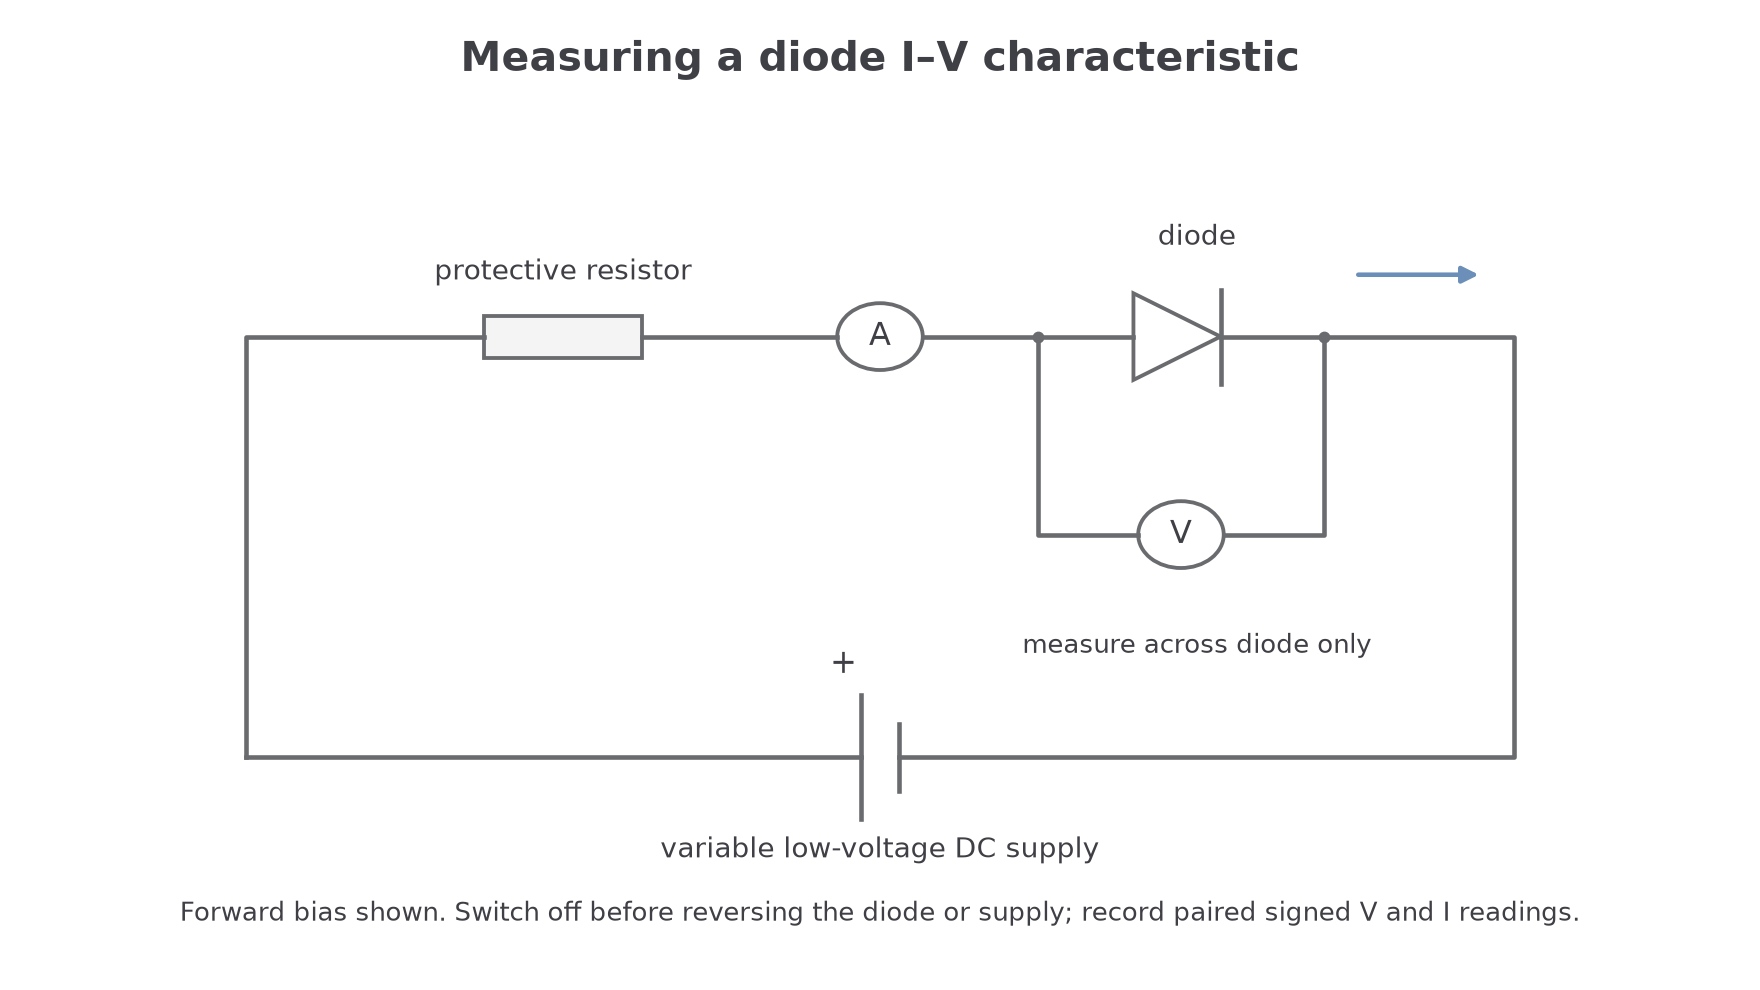
The basic measurement route is:
- Put the component and ammeter in series, so the ammeter measures the current through the component.
- Connect the voltmeter in parallel with the component, so it measures the p.d. across that component.
- Use a variable dc supply or a variable resistor to change the p.d. in small steps.
- Record paired readings of and .
- Reverse the supply connections if negative p.d. readings are needed.
- Plot on the vertical axis against on the horizontal axis, unless the question states otherwise.
There are two practical details that carry a lot of physics.
First, components can heat up. For an ohmic conductor investigation, you try to keep temperature constant by using small currents, switching off between readings or taking readings quickly. For a filament bulb or thermistor, heating is part of the characteristic, but readings should still be steady and repeatable.
Second, a diode can conduct a large current when forward biased. Use a protective series resistor or current-limited supply so the diode is not damaged. In reverse bias, expect very small current over the normal school-lab range.
For a graph, "sketch" and "plot" are different commands. A sketch needs labelled axes and the key shape features. A plot needs suitable scales, units, accurate points and a sensible best-fit line or curve.
Power and Heating from Graph Data
The power equation and the I-V graph are not separate tools. At any point on an I-V graph, the component's power is
using the coordinates of that point.
That means a graph can answer questions about heating and brightness. A filament bulb at transfers
.
At , it transfers
.
The larger-power point means more energy transferred per second, so the filament is hotter and brighter. It also explains the shape: as the filament gets hotter, resistance rises, so each extra volt gives a smaller extra current than it did near the origin.
When a question says "calculate", show the substitution and the unit. When it says "derive", show how is combined with . When it says "interpret" an I-V graph, link a feature of the graph to a physical change in the component, such as resistance increasing, resistance decreasing, or current being blocked in reverse bias.
At fixed voltage, , so increasing resistance reduces power. At fixed current, , so increasing resistance increases power. There is no contradiction: the condition held fixed is different. For a lamp connected to a constant-voltage source, its initially cold, low-resistance filament draws a larger current than its hot operating current. As it warms, resistance rises and the current falls towards a steady value.