159-160 - Hertzsprung-Russell Diagrams and Stellar Life Cycles
This lesson covers how to sketch and interpret a simple Hertzsprung-Russell diagram, and how to connect positions on the diagram to the life cycle of stars. The diagram is a map of two measured properties: stellar luminosity and surface temperature. The trick is to read the axes carefully before turning a point on the graph into a story about a star.
A map of stars
Imagine an astronomer with a catalogue of stars. For each star, two useful quantities can be estimated:
- luminosity, : the total power output of the star, often compared with the Sun as
- surface temperature, : the temperature of the visible surface, measured in kelvin,
A Hertzsprung-Russell diagram, usually shortened to H-R diagram, plots these two quantities on one graph.
The vertical axis is luminosity. Higher on the graph means a star has a greater power output.
The horizontal axis is surface temperature. This axis is usually drawn with hotter stars on the left and cooler stars on the right. That convention is easy to miss because it is the opposite of many graphs where the x-value increases left to right.
So the first reading habit is:
On an H-R diagram: up = more luminous; left = hotter surface; right = cooler surface.
Many real H-R diagrams use logarithmic scales because stars cover huge ranges of luminosity and temperature. Here, the important skill is the simple sketch and interpretation: axes, direction, main regions and what a point's position means physically.
Misconception contrast: a star plotted to the right is not "larger on the x-axis" in the usual increasing-temperature sense. On an H-R diagram, right usually means cooler surface temperature.
The main sequence is a band
When many stars are plotted, most do not scatter randomly. They form a broad diagonal band called the main sequence.
Main sequence
The diagonal band on an H-R diagram occupied by stars in the long, stable stage of their lives, fusing hydrogen in their cores; position along it depends mainly on mass.
Main-sequence stars are in the long stable stage of their lives, with hydrogen fusion in their cores providing the heating that maintains the outward pressure gradient balancing the inward gravitational force. The Sun is a main-sequence star.
The main sequence runs from:
Mass is the key reason for the position along the band. A high-mass main-sequence star is hotter and more luminous, so it lies towards the upper left. A low-mass main-sequence star is cooler and less luminous, so it lies towards the lower right.
This does not mean that one star starts at the top left and slides down the whole main sequence during its life. The main sequence is a population band: it shows many different stars of different masses that are all in the hydrogen-fusing stage.
Misconception contrast: "main sequence" sounds like a sequence of events. On the H-R diagram, it is not a timeline for one star. It is the region occupied by stars in the same broad life-cycle stage but with different masses.
Interpreting regions
The useful power of an H-R diagram is that position gives a physical interpretation. Read both coordinates before naming the region.
[DIAGRAM: asset_name: Hertzsprung-Russell diagram with logarithmic temperature decreasing rightwards, logarithmic luminosity increasing upwards, separate main sequence, giants, supergiants, white dwarf regions and Sun; asset_slug: 046_hr_diagrams_stellar_life_cycles__diagram_01; recommended_method: matplotlib; description: Hertzsprung-Russell diagram with logarithmic temperature decreasing rightwards, logarithmic luminosity increasing upwards, separate main sequence, giants, supergiants, white dwarf regions and Sun.]
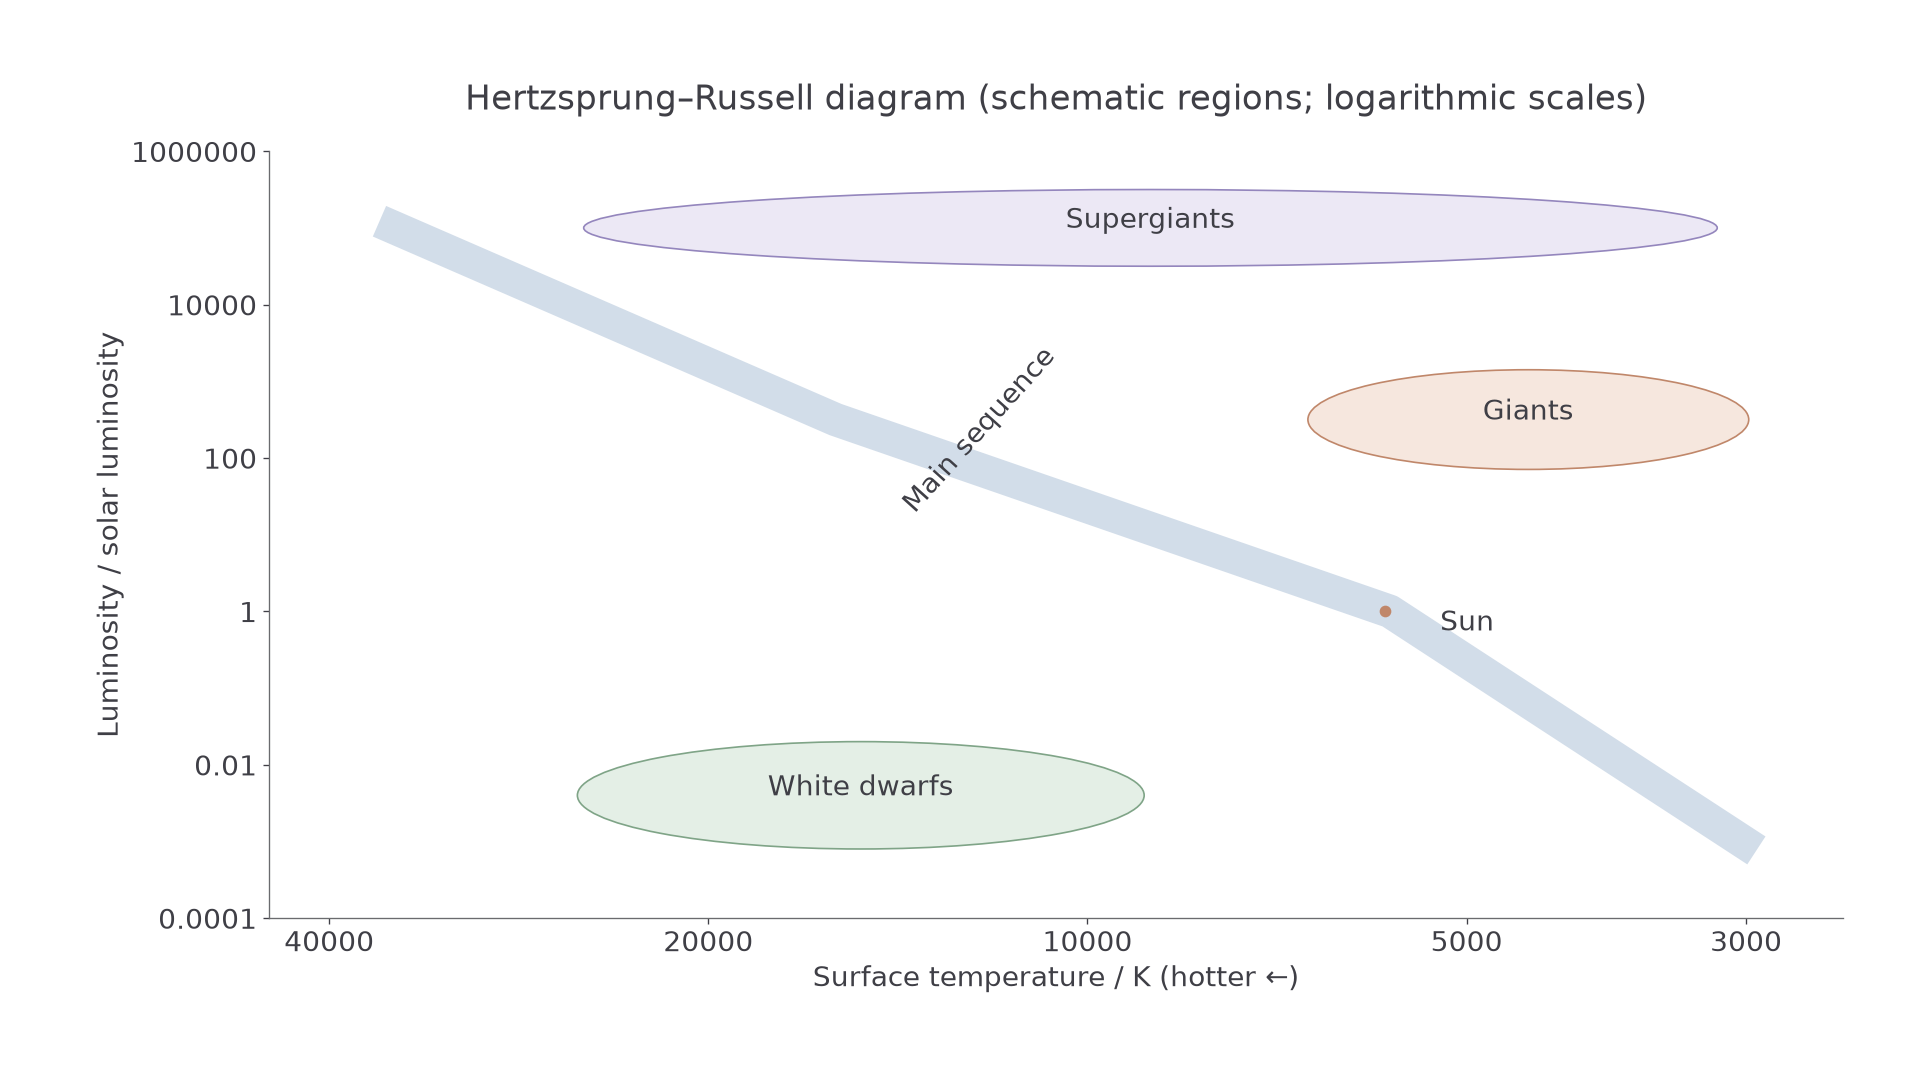
Worked interpretation:
A star has and .
Decision point 1: is cool for a star's surface, so the point is towards the right.
Decision point 2: is very luminous, so the point is high up.
Decision point 3: high and cool is not the lower-right main sequence. It is the upper-right giant or supergiant region.
The physical interpretation is that the star has a cool surface but an enormous radiating surface area, so its total luminosity is large. "Cooler" does not automatically mean "dim".
Second worked interpretation:
A star has and .
Decision point 1: is hot, so the point is towards the left.
Decision point 2: is low luminosity, so the point is low down.
Decision point 3: hot and dim is the lower-left white-dwarf region.
The physical interpretation is that the object has a hot surface but a very small radiating area, so the total luminosity is low.
For Edexcel “interpret” questions, do not just name a region. Link the position to both physical quantities: high/low luminosity and hot/cool surface temperature.
You can quantify the size inference using . For stars with equal luminosity, : a star with half the surface temperature needs four times the radius. More generally, . A giant and a main-sequence star can share a surface temperature but have very different radii and luminosities.
A Sun-like route
The H-R diagram becomes a life-cycle map when you ask how a star's position changes as its internal energy source and size change.
A Sun-like star spends most of its life on the main sequence. In this stage, hydrogen fusion in the core provides the energy output that keeps the star stable.
Continue this lesson.
You’re previewing NovaLearn without an account. Create a free account to read the rest.
Create free account