172-173 - Radioactive Decay, Half-Life and Activity
This lesson connects the unpredictable decay of a single nucleus to a predictable law for a large sample. You will use activity, half-life, exponential decay equations and log plots to describe how the number of undecayed nuclei changes with time. The lesson stays within radioactive decay and graphical half-life methods; absorption and penetration belong to the previous lesson.
Random nuclei, predictable samples
Imagine a sealed radioactive source beside a detector. The detector clicks when radiation from a decay is detected, but no one can point to one particular unstable nucleus and say, "that one will decay next."
Nuclear decay is spontaneous: it is not caused by ordinary external conditions such as heating, cooling, pressure or illumination. It is also random: for one unstable nucleus, the exact time of decay cannot be predicted.
The useful pattern appears when there are many identical unstable nuclei. Each undecayed nucleus has the same probability of decaying per unit time. That probability per unit time is the decay constant, written .
Decay constant
The probability per unit time that an undecayed nucleus will decay, (unit ).
- is measured in if time is measured in seconds.
- A larger means a greater probability per second, so the source decays faster.
- The nuclei do not take turns or become "due" after waiting for one half-life.
That last point is the key contrast. A half-life is not a timer attached to each nucleus. It is the time for the expected number of undecayed nuclei in a large sample, and therefore the activity, to halve. The individual events remain random; the large-sample trend becomes smooth enough to model.
Half-life
The time taken for the number of undecayed nuclei (and so the activity) of a radioactive isotope to halve.
A sample also does not usually lose half its visible mass or volume after one half-life. What halves is the number of undecayed radioactive nuclei of that isotope. If the sample is mostly stable material with a tiny amount of a radioactive isotope inside it, its visible size may barely change while its activity drops a lot.
Activity is a rate
The activity of a radioactive source is the number of decays per second. Its unit is the becquerel, , where:
If a sample contains undecayed radioactive nuclei, and each nucleus has decay probability per unit time , then the expected number of decays per second is:
Activity
: activity, decays per second (Bq); : decay constant (); : number of undecayed nuclei.
This equation is more than a substitution rule. It says activity is high when there are many undecayed nuclei left, or when each nucleus has a high probability of decaying each second.
The number is falling, so its rate of change is negative:
The minus sign is a direction sign: decreases with time. Activity itself is normally quoted as a positive rate.
Now add the detector. A detector in a lab does not hear only the source; it also records background count rate from natural and environmental radiation. In lesson and exam data, use the corrected count rate when it is standing in for source activity:
In a real experiment, detector efficiency and geometry also matter, but Edexcel questions will state what is needed. The important habit here is not to treat raw count rate as automatically equal to source activity.
Because decay events are random, short counting intervals can fluctuate noticeably. A more reliable activity estimate comes from counting for longer, or repeating counts and taking a mean, then subtracting a background count measured in the same units.
Worked route:
A source contains undecayed nuclei of a radioactive isotope. Its decay constant is . Calculate the activity.
Choose because the question gives the number of undecayed nuclei and the decay constant.
The unit works because is a count, so the from becomes decays per second. A tempting wrong route is to use half-life immediately, but no half-life is given or needed.
You can model the rate equation in small time steps without solving a differential equation. Over a short interval , the expected change is , so . In a spreadsheet, enter time and N in adjacent columns, increase time by , and multiply the previous N by this factor in each new row. For , and , the first estimates are 10000, 9800 and 9604. The loss gets smaller as N falls. Choose and repeat with a smaller step to check convergence; these values are expected populations, not predictions of individual decay events.
Determining half-life graphically
Half-life can be determined from a graph of background-corrected count rate against time, or from a graph of the number of undecayed nuclei against time. Both quantities halve in the same time because .
[DIAGRAM: asset_name: Corrected count rate 80 times 2 to the power minus t/3, against hours; asset_slug: 050_radioactive_decay_half_life_activity__diagram_01; recommended_method: matplotlib; description: Corrected count rate 80 times 2 to the power minus t/3, against hours; halves at 3,6,9 hours; companion natural-log straight line.]
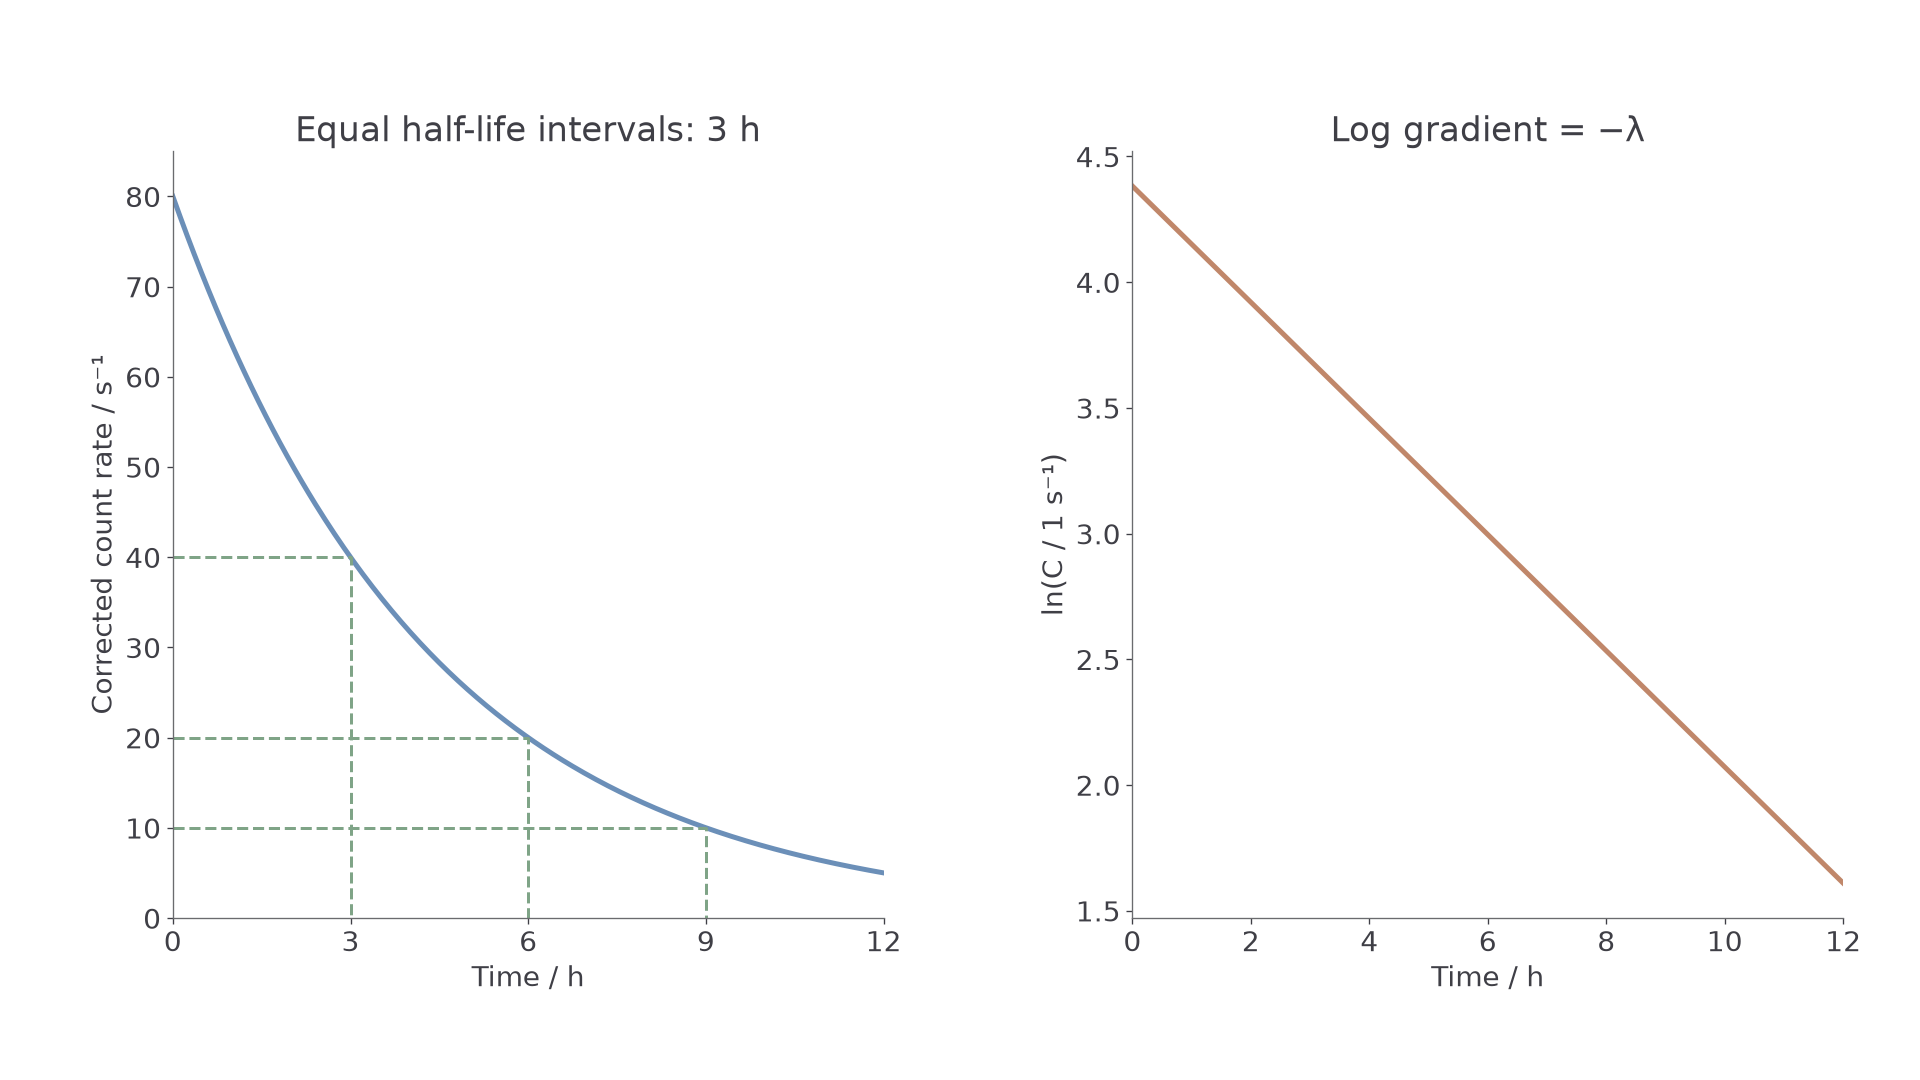
The graph method is:
- Start from a background-corrected count rate on the curve.
- Halve that activity.
- Read horizontally to the curve at the halved activity.
- Read down to the time axis.
- The time difference between the two readings is the half-life.
Continue this lesson.
You’re previewing NovaLearn without an account. Create a free account to read the rest.
Create free account