59-64 - Wave Quantities and Speed of Sound (CP6)
Wave quantities, the wave speed equation, longitudinal and transverse waves, and Core Practical 6 (speed of sound). The aim is to connect the visible pattern of a wave to measurable quantities and practical evidence.
A wave is a travelling pattern
Imagine a loudspeaker cone moving in and out. The cone does not throw air across the room like a ball. It repeatedly pushes and pulls the air next to it, and that disturbance is passed from one region of air to the next. The wave is the travelling pattern; the particles of the medium mostly oscillate about their equilibrium positions.
The first wave quantities name measurable features of that pattern:
| Quantity | Symbol often used | Meaning | SI unit |
|---|---|---|---|
| amplitude | A | maximum displacement from equilibrium, or maximum size of the disturbance | metre, m, for displacement |
| frequency | number of complete cycles passing a point each second | hertz, Hz | |
| period | time for one complete cycle | second, s | |
| wavelength | distance between matching points on neighbouring cycles, such as crest to crest or compression to compression | metre, m | |
| wave speed | speed at which the pattern or disturbance travels |
Frequency and period describe the same rhythm from opposite directions:
Frequency and period
: frequency (Hz); : period (s).
So a frequency of means 50 cycles each second, and each cycle takes .
Misconception contrast: a larger amplitude means a larger maximum displacement or pressure variation. It does not, by itself, mean the wave travels faster. Speed depends on the wave and the medium, not simply on how tall the graph looks.
The wave equation as one-cycle bookkeeping
The wave equation is not a new idea to memorise separately from the meanings. It is bookkeeping for cycles.
If one complete cycle has length , and cycles pass each second, then in one second the pattern travels:
That is why:
Wave equation
: wave speed (m s⁻¹); : frequency (Hz); : wavelength (m). Applies to any travelling wave.
Check the units as you use it:
Worked example: a signal generator drives a loudspeaker at . In air, the distance between two equivalent points in the sound wave is measured as . Calculate the speed of the sound wave.
Decision point 1: convert before substituting.
Decision point 2: choose , because the question gives cycles per second and distance per cycle.
Decision point 3: interpret the answer. is the speed of the sound disturbance through the air. It is not the speed at which any one air molecule travels from the speaker to the microphone.
The wave speed is the speed of the pattern (and of energy transfer), not of the particles: each particle of the medium only oscillates about its equilibrium position.
For Edexcel "calculate" questions, show the conversion if a prefix such as or cm appears, show substitution into the relationship, and give the final unit unless it is already supplied.
Transverse and longitudinal waves
To describe a wave, ask two questions:
- Which way does the wave travel?
- Which way do the particles or field oscillate?
Transverse wave
A wave in which the oscillations are perpendicular to the direction of energy transfer, for example a wave along a rope.
Longitudinal wave
A wave in which the oscillations are parallel to the direction of energy transfer, for example sound.
A wave travelling horizontally along a rope can have rope elements moving up and down. Sound in air is the key example here. The air molecules oscillate backwards and forwards along the same line as the sound travels.
For sound, Edexcel expects the description to include both molecular displacement and pressure variation:
- in a compression, air molecules are closer together than normal and the pressure is higher than normal;
- in a rarefaction, air molecules are further apart than normal and the pressure is lower than normal;
- each molecule only oscillates about its equilibrium position;
- the pressure disturbance travels through the air.
Misconception contrast: a drawn sine curve for a sound wave is usually a graph of pressure variation or displacement against position or time. It is not a picture of air molecules moving up and down. In air, the molecule displacement is along the direction of travel.
For Edexcel "describe" questions, give linked physical statements rather than isolated labels. "Longitudinal" on its own is not enough; say what oscillates, the direction of oscillation, and how pressure varies.
Reading wave graphs
The safest first move with any wave graph is to read the horizontal axis.
[DIAGRAM: asset_name: wave graphs; asset_slug: 9ph0_wave_graphs; recommended_method: matplotlib; description: Displacement–time graph distinguished from longitudinal displacement and pressure position snapshots separated by a quarter wavelength.]
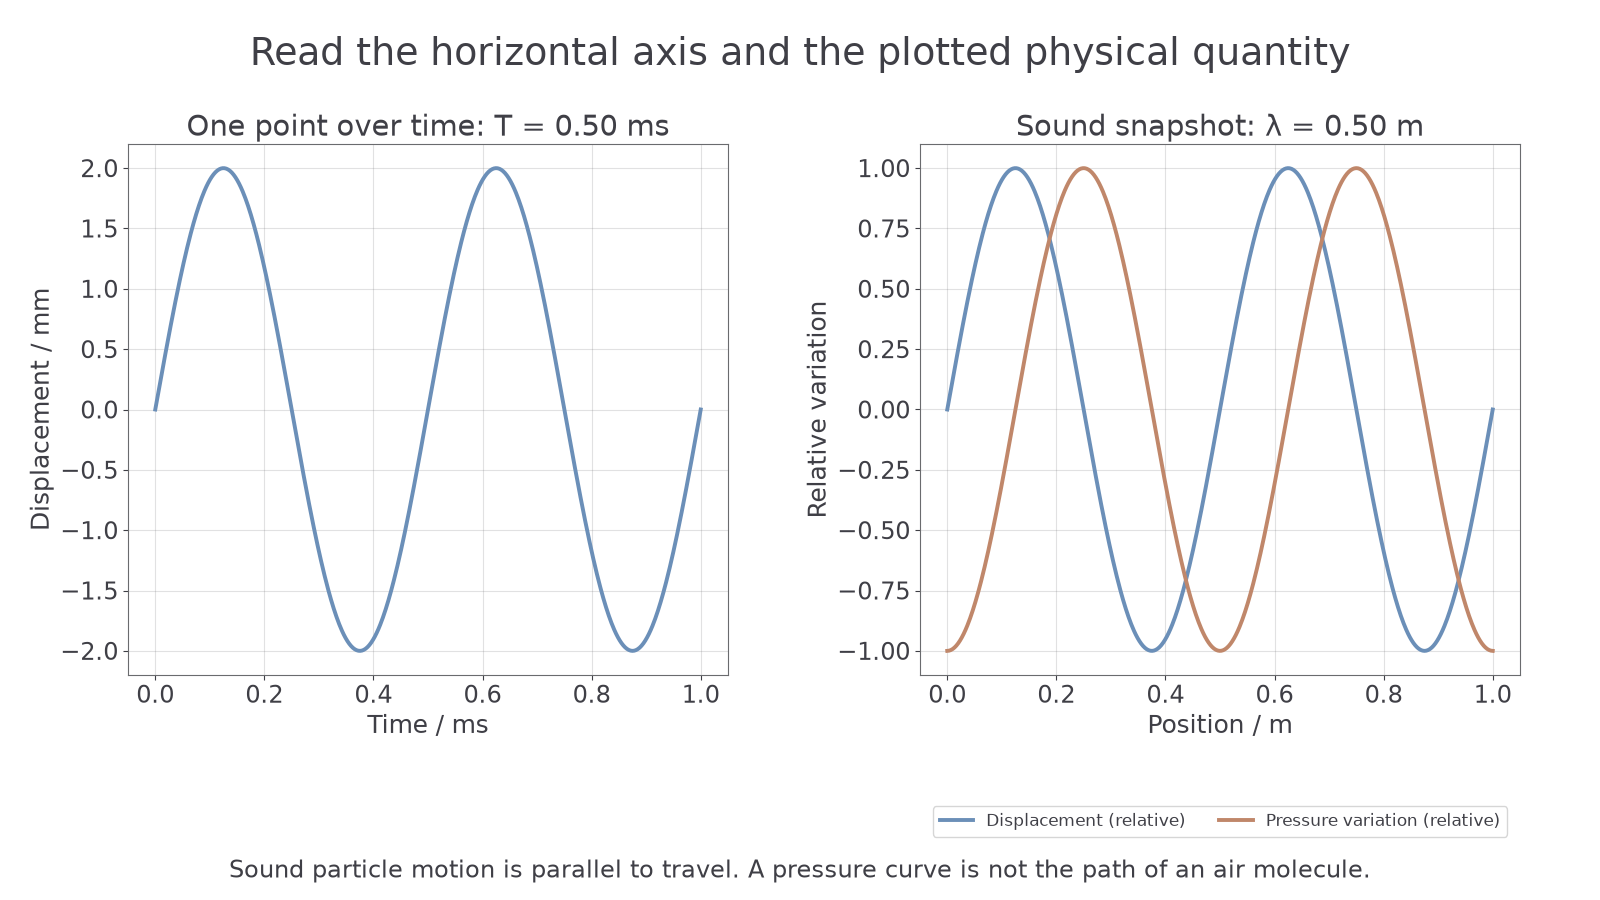
If the horizontal axis is position or distance, the graph is a snapshot of the wave at one instant. You can read:
- amplitude from the maximum vertical displacement from equilibrium;
- wavelength from the horizontal spacing between matching points, such as crest to crest, trough to trough, compression to compression, or rarefaction to rarefaction.
If the horizontal axis is time, the graph shows what one point in the medium does over time. You can read:
- amplitude from the maximum vertical displacement from equilibrium;
- period from the time between matching points on neighbouring cycles;
- frequency from .
A longitudinal wave graph may show pressure variation against position. Then neighbouring pressure maxima are one wavelength apart. It may also show molecular displacement against position or time. Do not treat the drawn curve as the physical path of the molecules.
A standing or stationary wave graph shows how displacement varies along the medium. Read the axis and identify the fixed pattern of maximum and zero displacement positions. For a sinusoidal stationary mode, maximum-displacement positions lie halfway between adjacent zero-displacement positions. How the pattern is formed, phase/path difference, and the node/antinode vocabulary are developed in the next lesson.
To sketch a sinusoidal travelling-wave graph, label the horizontal axis as time or position and the vertical axis as displacement or pressure variation. Draw the equilibrium line, mark the maximum displacement A for a displacement graph, and space equivalent points by on a time graph or on a position graph. A pressure graph represents high and low pressure, rather than a sideways path of the air molecules. For a sinusoidal stationary displacement-position snapshot, place fixed zeros half a wavelength apart and draw alternating positive and negative loops between them; the largest displacement is halfway between adjacent zeros. At another instant the loop heights change, while the zero-displacement positions stay fixed.
Worked example: a displacement-time graph for one point on a wave has crests at and . A separate displacement-position snapshot of the same wave has adjacent crests apart. Determine the wave speed.
Decision point 1: the time graph gives period, not wavelength.
Decision point 2: the position graph gives wavelength.
Decision point 3: now combine them.
For Edexcel "interpret" tasks, write what graph feature you used. For example, "The crest-to-crest separation on the distance axis gives wavelength" is stronger than a bare number.
Continue this lesson.
You’re previewing NovaLearn without an account. Create a free account to read the rest.
Create free account