184-187 - Oscillation Graphs and Resonance (CP16)
This lesson turns oscillations into evidence: graphs tell you velocity and acceleration, resonance tells you why one frequency matters most, and Core Practical 16 uses that frequency to find an unknown mass. The lesson uses a spring-mass oscillator as the main story, but the same graph reasoning applies to any object moving back and forth along one line.
Displacement-time gradients
Picture a mass hanging from a spring. Choose downward displacement from the equilibrium position as positive. When the mass is below equilibrium, is positive; when it is above equilibrium, is negative. Displacement is measured in metres, m.
A displacement-time graph answers the question: where is the oscillator at each instant?
The gradient of a displacement-time graph gives the velocity at that instant:
This is the same gradient idea used in mechanics, but now the graph is curved. For a curved graph, the velocity at a point is found from the tangent at that point, not from a chord drawn across a large part of the cycle.
[DIAGRAM: asset_name: Aligned normalised displacement, velocity and acceleration against time in periods; asset_slug: 054_oscillation_graphs_resonance_core_practical__diagram_01; recommended_method: matplotlib; description: Aligned normalised displacement, velocity and acceleration against time in periods; cosine, minus sine and minus cosine respectively.]
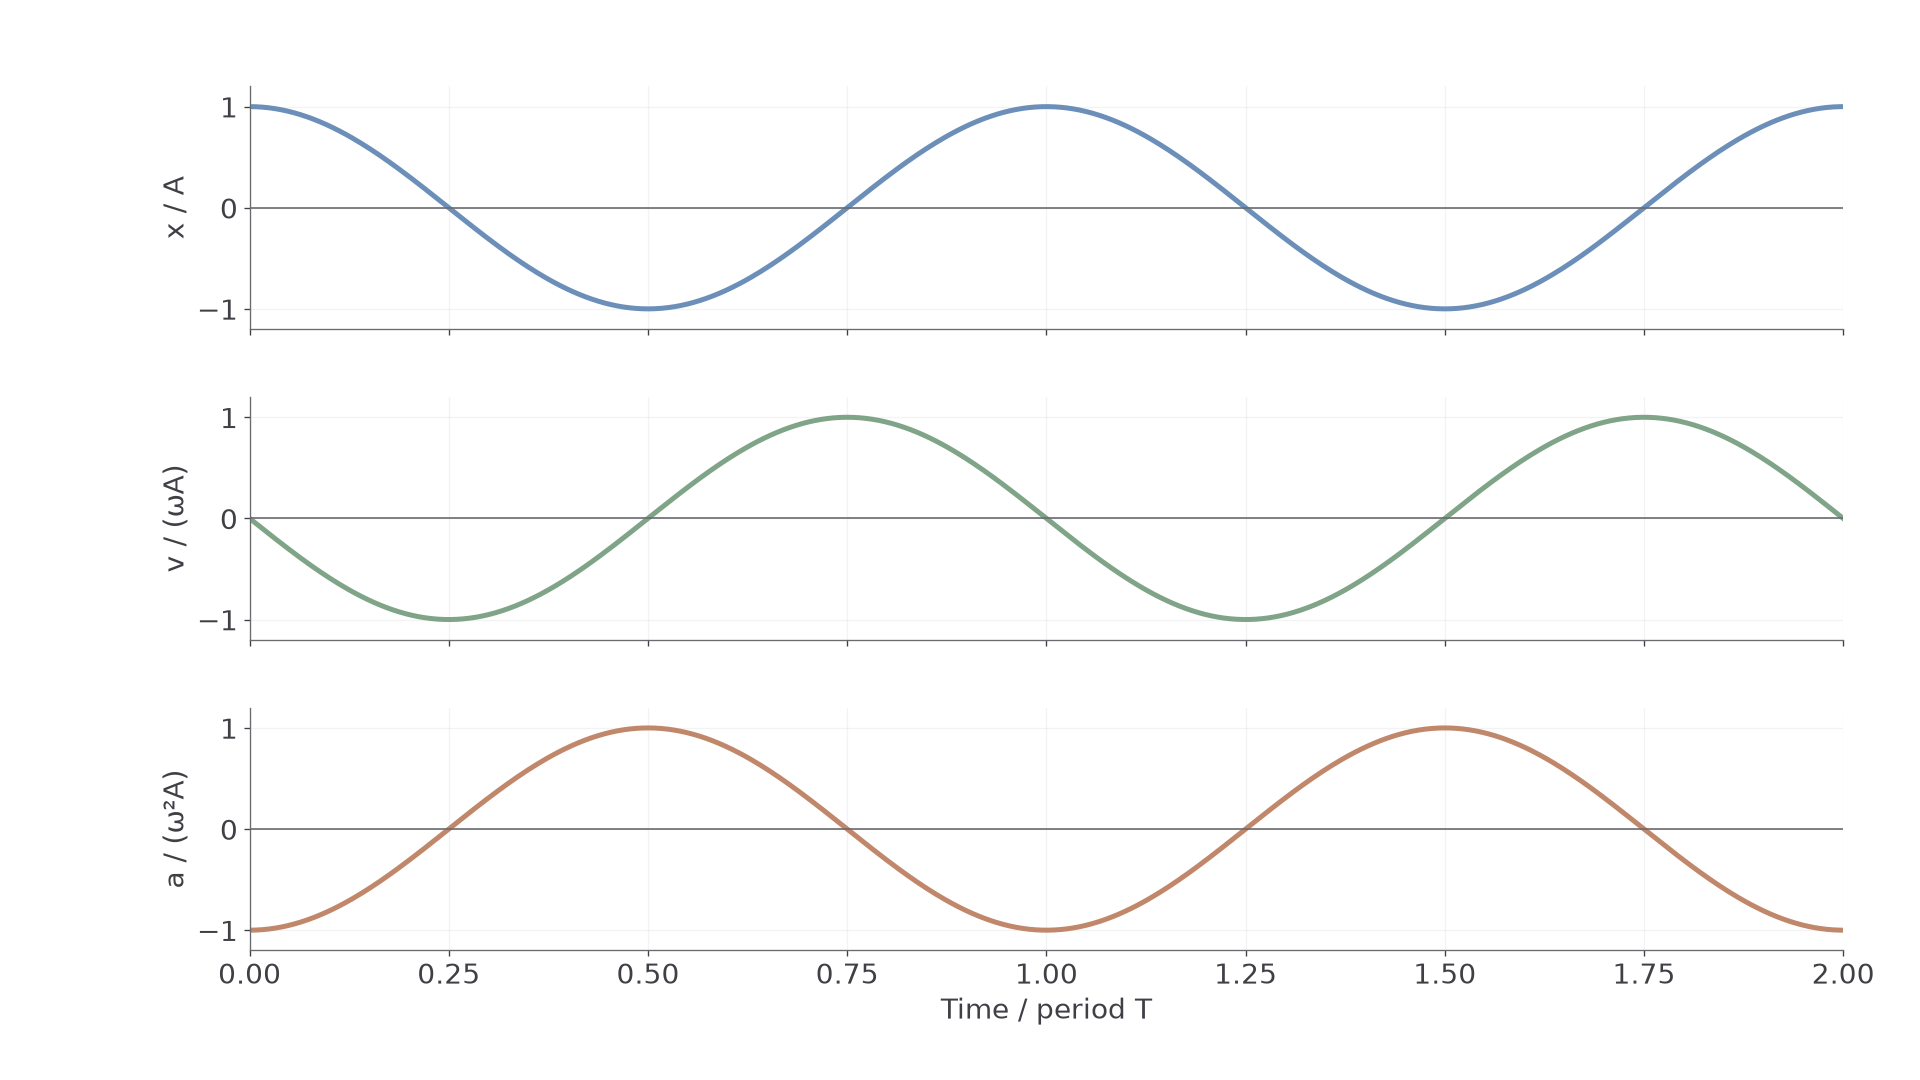
Read the shape physically:
- At maximum positive displacement the graph has a horizontal tangent, so the instantaneous velocity is zero. The mass has paused before moving back.
- As the mass passes equilibrium the displacement-time graph is steepest, so the speed is largest.
- A downward-sloping tangent means negative velocity relative to the chosen positive direction.
- A steeper displacement-time graph means greater speed, not greater acceleration.
Worked example: a tangent on a displacement-time graph passes through approximately and . Estimate the velocity at the point where the tangent touches the curve.
Decision point: use the tangent points, because the question asks for the velocity at an instant.
The negative sign means the mass is moving in the negative displacement direction. It does not mean the mass is slowing down.
Displacement-time gradient = velocity (zero at the extremes, greatest at equilibrium). Velocity-time gradient = acceleration (zero at equilibrium, greatest at the extremes, always towards equilibrium).
For Edexcel “interpret” questions, the mark is usually not just for saying "gradient". Link the graph feature to the physical motion: horizontal tangent means zero velocity; steepest tangent means maximum speed; positive or negative gradient gives direction.
Velocity-time gradients
A velocity-time graph answers a different question: how fast is the oscillator moving, and in which direction?
The gradient of a velocity-time graph gives the acceleration at that instant:
This time the sign of the gradient tells you the direction of acceleration. For a spring-mass oscillator, the acceleration is always directed back towards equilibrium. That is why, when the mass is far below equilibrium, it accelerates upwards; when it is far above equilibrium, it accelerates downwards.
On a velocity-time graph:
- a horizontal tangent means zero acceleration at that instant
- the graph crossing means the oscillator is momentarily stationary
- the steepness of the tangent gives acceleration, not velocity
- positive velocity and positive acceleration are not the same thing
Worked example: on a velocity-time graph, a tangent at one point passes through and . Determine the acceleration at that point.
Decision point: this is a velocity-time graph, so the tangent gradient has units , which becomes .
The acceleration is negative. If downward was chosen as positive, this means the acceleration is upwards at that instant.
Misconception contrast: the top of a velocity-time graph is not the maximum displacement. It is the maximum positive velocity. To know where the oscillator is, you need the displacement-time graph or the phase relationship from the oscillator model.
For Edexcel “draw” or “sketch” graph tasks, show the important features: labelled axes, smooth sinusoidal shape, correct zeros and maxima, and the correct phase relationship. A sketch does not need a perfect scale, but it must show the physics.
Resonance as frequency matching
Natural frequency
The frequency at which a system oscillates when displaced and then left to oscillate freely.
For a mass on a spring, changing the mass changes this frequency.
Resonance occurs when an oscillator is driven at its natural frequency. Small energy transfers arrive at the right part of each cycle, so the response becomes large. A child on a swing is the familiar picture: pushes at the right frequency build the motion; pushes at a badly timed frequency do much less.
Keep the definition tight:
Resonance
A large-amplitude response that occurs when the driving frequency of a forced oscillation equals the natural frequency of the system.
The detailed effect of damping on the resonance peak belongs to the next lesson. Here the key idea is frequency matching.
For the core practical, the useful measured quantity is often the period , the time for one complete oscillation. Frequency is the number of oscillations per second:
So a resonant frequency and a resonant period contain the same information. If the unknown mass has a longer period, it has a lower frequency.
For Edexcel “explain” questions, a definition alone is usually thin. Link the ideas: the system has a natural frequency; the driver matches it; energy transfer is efficient; the amplitude becomes large.
Core Practical 16 setup
Core Practical 16 uses a simple idea: if the spring is the same, changing the attached mass changes the period and frequency. Pearson’s official CP16 worksheet obtains this natural/resonant frequency by timing free oscillations after release, with ; a continuously driven resonance scan is not required for that worksheet method. A driven experiment instead locates the large-amplitude peak as driving frequency is varied. Measure the periods for known masses first, then use the unknown mass's period to find its mass.
Continue this lesson.
You’re previewing NovaLearn without an account. Create a free account to read the rest.
Create free account