9.1.8, 3.2.1, 3.2.3, 5.2.2, 7.2.3, 8.2.3 - Correlations and comparative designs
Learn how psychologists investigate relationships, development and variation when they cannot manipulate people's lives. Compare correlations, studies across time and cultures, family comparisons and meta-analysis, and decide what their evidence can support.
Co-variables and causal limits
A correlation asks whether two measured variables vary together rather than whether an experimentally manipulated variable causes an outcome.
Co-variables
The two variables measured for each person or other unit in a correlational investigation.
For example, a researcher could record each consenting adult's usual sleep duration and attention-test score. Both must be operationalised: “hours slept last night” differs from “average nightly hours over the last week”. Neither is an independent variable manipulated by the researcher. Using the same participant's two scores preserves the pairing that the question requires.
In a positive correlation, higher values of one co-variable tend to accompany higher values of the other. In a negative correlation, higher values tend to accompany lower values. “Negative” describes direction, not a bad result. With no correlation, there is no clear relationship; a lack of a straight-line trend does not rule out a curved relationship.
A scatter diagram puts one co-variable on each labelled axis and one point at each pair of scores. Read from left to right: a rising cloud suggests a positive relationship and a falling cloud a negative one. A tight cloud around a trend suggests a stronger relationship than a widely scattered cloud. An outlier can influence the apparent pattern. A scatter plot is appropriate because each unit supplies two measurements; a bar showing only each variable's average would lose the pairing. Calculating a coefficient and drawing exact graphs are taught in the data lessons.
An association does not resolve directionality: sleep might affect attention, but difficulty studying might also disrupt sleep. A third variable, such as illness, could affect both. Even a large, statistically significant correlation cannot remove these alternative explanations by itself. Correlations nevertheless identify possible risk factors, allow prediction and investigate variables such as age that cannot ethically be assigned. Prediction can be useful without demonstrating a cause.
Change over time and cohort differences
Developmental research must distinguish change within a person from differences between people born or raised at different times.
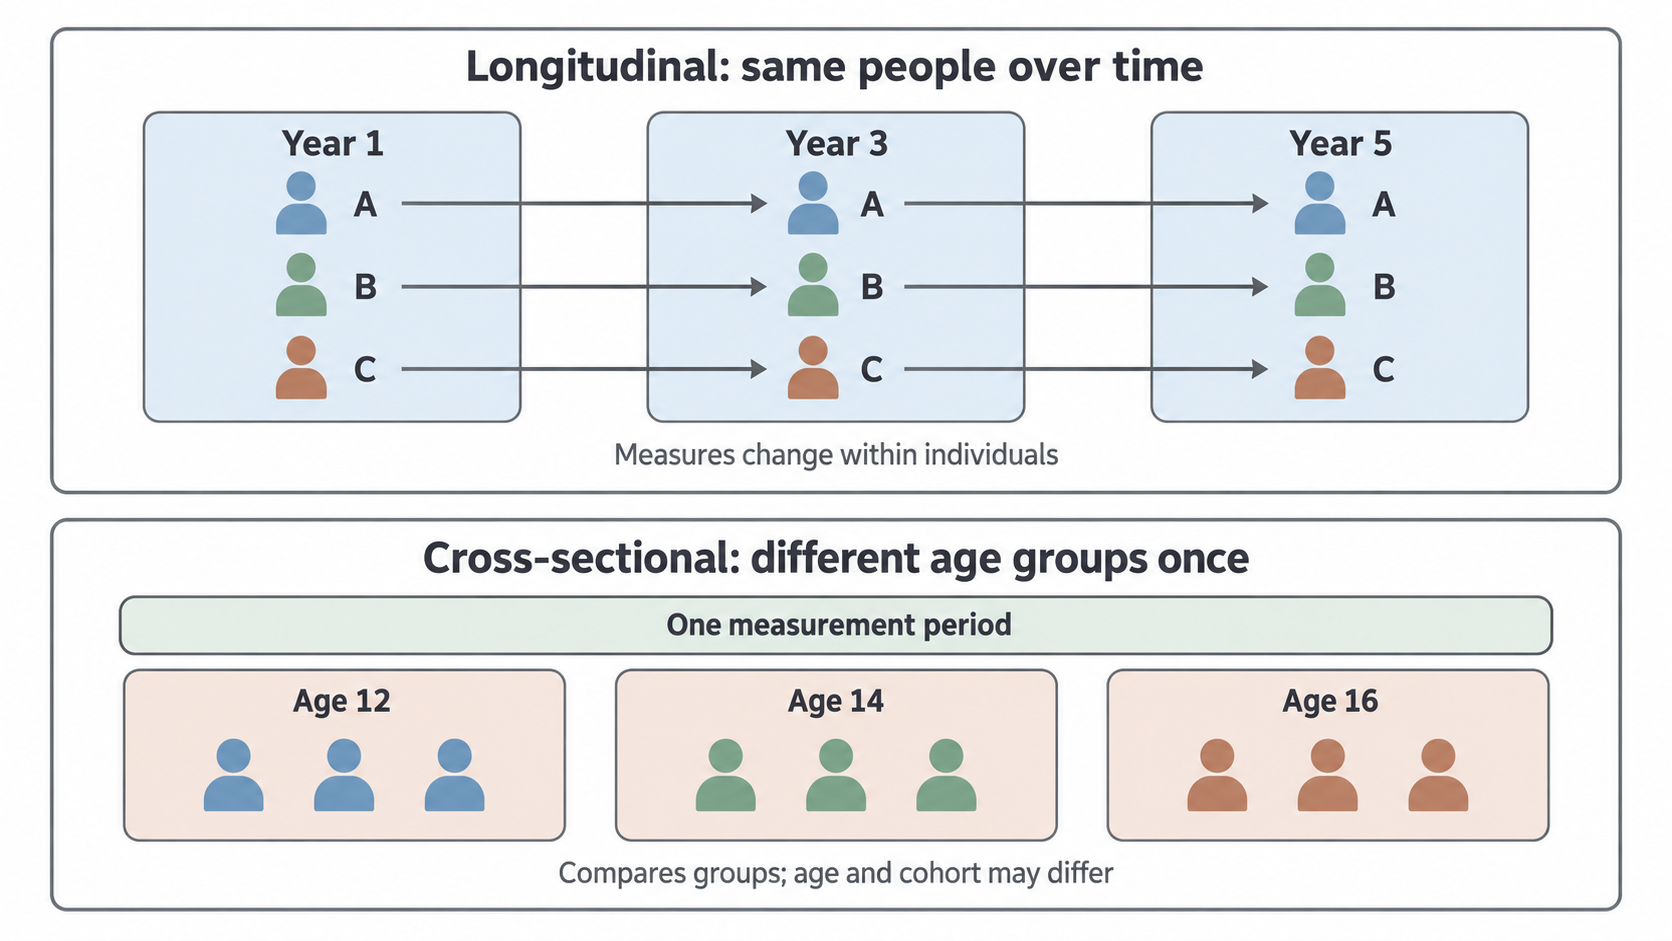
In a longitudinal design, the same people are assessed on separate occasions. Following the same participants' memory over several years shows individual trajectories and establishes whether an earlier measure preceded a later outcome. Stable individual differences are less likely to explain within-person change. However, time order alone does not prove causation: life events or treatments could change both variables.
Longitudinal work takes time and money. Attrition means participants leave the study; if people with worse symptoms are harder to contact, the retained sample may appear healthier than the original population. Repeated testing can produce practice effects. Researchers can use equivalent test versions, keep appropriate contact arrangements and report who was lost, while recognising that these measures do not guarantee unbiased follow-up.
A cross-sectional design compares different groups at one measurement period, such as memory performance among 12-, 14- and 16-year-olds. It is quicker and avoids repeated-test practice effects. But differences between ages may be cohort effects: each birth group experienced different schooling or social circumstances. It does not show that a particular 12-year-old would follow the older group's pattern. Matching relevant characteristics and using the same measurement procedure improve comparability, without making the groups identical.
[DIAGRAM: asset_name: Longitudinal and cross-sectional designs; asset_slug: edexcel_9ps0_r06_longitudinal_cross_sectional; recommended_method: image_gen; description: The same lettered people are followed across three years in a longitudinal design, while different age groups are measured during one period in a cross-sectional design.; caption: Longitudinal evidence follows individuals; cross-sectional evidence compares different groups once.]
These designs can use primary data, collected for the present question, or secondary data, collected previously for another purpose. A researcher's repeated symptom interviews are primary; an existing health-record archive is secondary. Secondary records may provide lengthy follow-up without waiting years, but changing diagnostic rules or missing entries can make times less comparable. Primary collection offers tailored measures but requires time, access and ethical approval.
Comparing cultures fairly
Cross-cultural research tests whether a psychological pattern appears in different cultural contexts, but a country label is not an explanation of behaviour.
Continue this lesson.
You’re previewing NovaLearn without an account. Create a free account to read the rest.
Create free account