4.5.1, 4.2.1, 4.2.3 - Learned-behaviour observation
The learning practical investigates an aspect of learned behaviour using observation. This lesson models one safe observation collecting both numerical tallies and descriptive notes, then shows how to analyse and report them without treating an association as proof of learning or causation.
A safe learned-behaviour question
A useful observation begins with a behaviour that can be recorded clearly and a question that can be answered without distress or deception.
The specification requires two observations, or one observation that gathers both qualitative and quantitative data. It also requires note taking, tallying, thematic analysis, quantitative tables/graphs and a chi-squared analysis. The example here investigates whether verbal greetings on entry to an adult learning room are associated with a quiet or busy setting. Greeting conventions can be learned through modelling and reinforcement, so the behaviour is relevant to learning theory. Observing greetings alone cannot establish when or how anyone learned them.
The research question is: “Is room setting associated with whether consenting adult participants greet another person on entry?” A nondirectional alternative hypothesis predicts an association between setting category and greeting category; the null hypothesis predicts no association in the population. Specify “quiet” as no more than five other people already present and “busy” as at least fifteen. Exclude intermediate occupancy under a rule agreed before collection. This is a comparison of naturally occurring settings, not manipulation of an independent variable.
Recruit adult volunteers with the organiser's approval and provide clear information, voluntary informed consent and a withdrawal deadline before anonymisation. Declining must not affect grades or access to the activity. Observe only consenting participants in the agreed setting, exclude bystanders from records, and collect no sensitive conversations, photographs or audio. Use agreed non-identifying codes for duplicate checks and possible removal; delete codes before final anonymous analysis. Participants may stop without giving a reason. Never stage a frightening event, withhold necessary help or watch traffic from an unsafe position for this practical.
An opportunity sample of available consenting adults is feasible, but it may overrepresent sociable people or a particular course. Plan comparable observation windows and enough different participants to make analysis useful. Pilot the category definitions and procedure on a small consented sample before the main collection. Pilot records are separate from the final data if the procedure changes. If an ethical, adequate sample cannot be obtained, use supplied data for analysis and report that the personal investigation has not been conducted.
Categories and sampling behaviour
Operational categories determine what the observers count and keep interpretation separate from the recorded behaviour.
Define “greeting present” as an audible “hello”, “good morning”, “welcome” or an equivalent phrase directed to another person within 15 seconds of entry. “Greeting absent” means no qualifying phrase in that interval. Include only entries where someone is available to greet; exclude prescribed group greetings or a teacher directly requesting a greeting. Code each participant's first eligible entry once, so one very talkative person cannot supply many supposedly independent cases. A sheet can contain setting, greeting category and an anonymised descriptive note.
The model is structured because it uses planned categories, non-participant because observers do not join the activity, naturalistic because ordinary room entry is not staged, and overt because people consent to being observed. These labels describe different dimensions: structured does not mean laboratory, and naturalistic does not mean covert. Participant observation would involve joining the activity; covert observation would conceal observation and creates additional consent/privacy problems. Neither is needed here.
Event sampling records eligible entry events as they occur. Use a tally in the correct setting/category cell and a short note describing what happened. Counting each person's first eligible entry preserves independence. Time sampling instead records behaviour at fixed intervals, such as whether a greeting occurs during each scheduled 30-second window. It may miss brief events and gives interval-based data, not automatically a count of independent people. Do not switch between these units during collection.
Train two observers with the same category examples and have them independently code the same pilot events. Compare agreement, inspect disagreements and clarify ambiguous cases before collecting the main sample. “Friendly behaviour” is too subjective unless turned into specific observable acts. A reliable definition still may omit non-verbal politeness or greetings in languages observers do not understand; refine it respectfully without guessing participants' intentions.
Tables and graphs of the observations
A results table should show the recorded counts before percentages or interpretations are added.
The following invented demonstration data represent 80 different consenting adults, each counted once. They are not observations collected by you and must not be submitted as your own practical results.
| Setting | Greeting present | Greeting absent | Total |
|---|---|---|---|
| Quiet | 30 | 10 | 40 |
| Busy | 20 | 20 | 40 |
| Total | 50 | 30 | 80 |
The quiet-setting greeting percentage is ; the busy-setting percentage is . The difference is 25 percentage points, not 25% of the busy percentage. Raw counts and denominators should remain visible, especially if group sizes differ.
A grouped bar chart suits these discrete nominal categories. The horizontal axis names settings, the vertical axis gives the number of participants and a legend distinguishes greeting present/absent. Separate bars represent categories; a histogram would imply a continuous numerical variable. Starting the count axis at zero prevents the visual difference being exaggerated.
[DIAGRAM: asset_name: Illustrative greeting observations; asset_slug: edexcel_9ps0_l10_greeting_counts; recommended_method: deterministic_plot; description: Grouped count bars show quiet present30 absent10 and busy present20 absent20, with count axis beginning at zero and invented-data label.; caption: Invented demonstration counts: each of the 80 participants supplies one greeting category in one setting.]
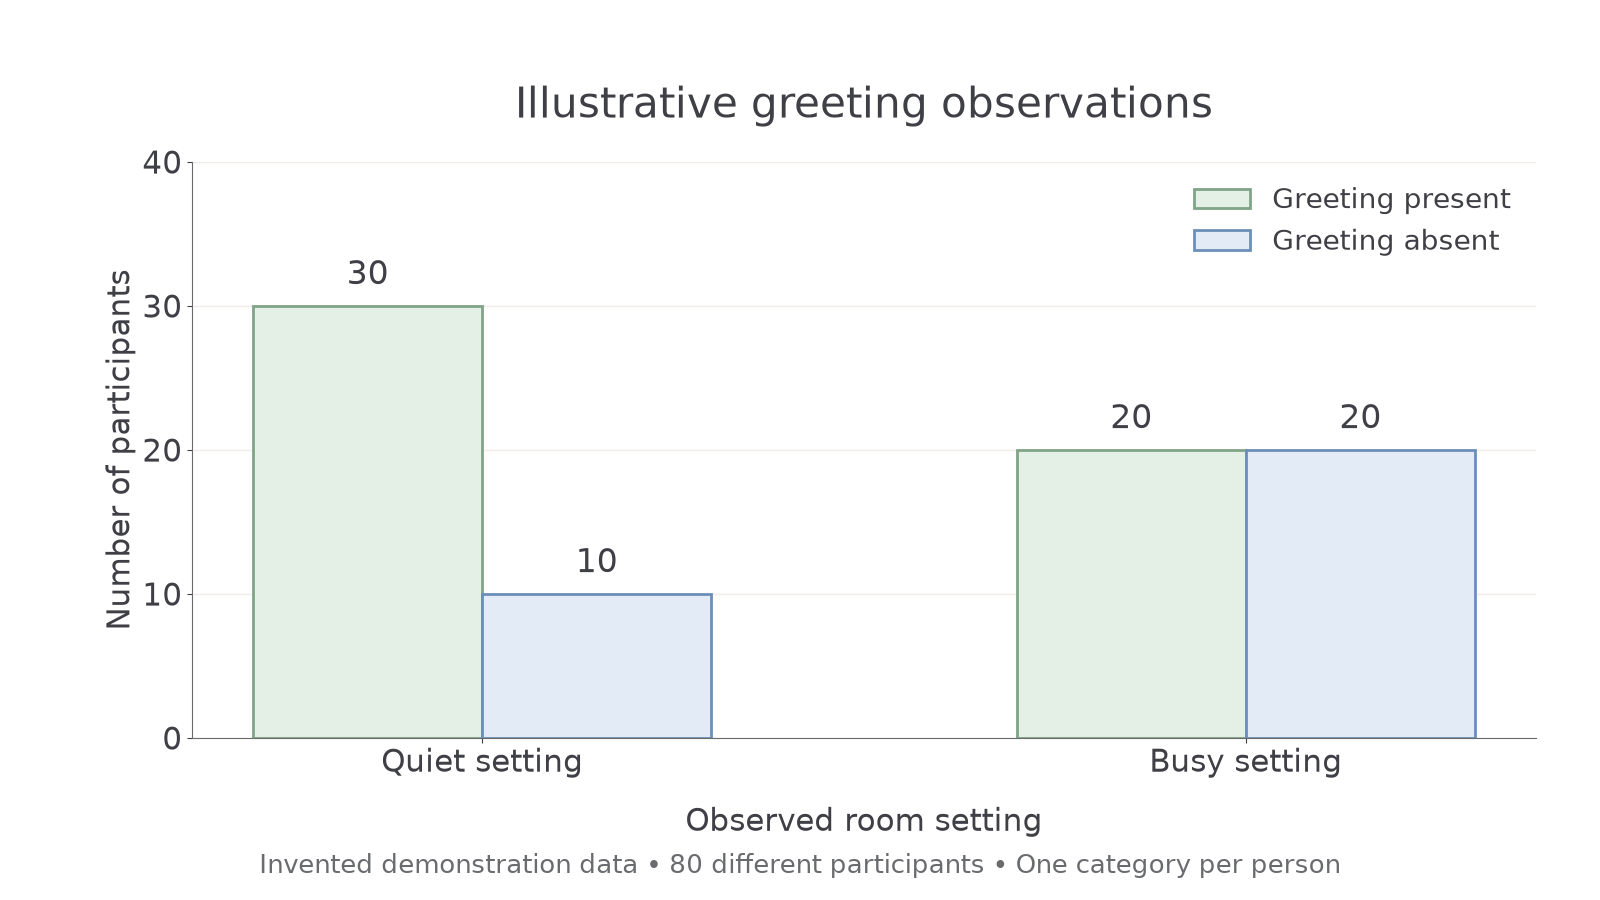
For an actual report, construct a table and a bar chart from your own ethical observations, using correct labels, counts and totals. Notebook graph construction is an ungraded practical skill here; a written answer interpreting the supplied graph does not certify that you plotted a graph. Check your drawing against the table, zero baseline, units and legend.
Continue this lesson.
You’re previewing NovaLearn without an account. Create a free account to read the rest.
Create free account