1.5.1, 1.2.1, 1.2.2, 1.2.3, 1.2.4, 1.2.5, 1.2.6, 1.2.7 - Social questionnaire investigation
Plan an ethical questionnaire investigation of a difference in in-group favouritism, gathering both numerical answers and participants’ reasons. Apply questionnaire and interview decisions (1.2.1–1.2.2), an alternate hypothesis (1.2.3), sampling (1.2.4), quantitative and thematic analysis (1.2.5–1.2.6), and ethical risk management (1.2.7) to the practical required by 1.5.1. The worked data are synthetic examples: completing this lesson does not mean that you have conducted the investigation.
A safe question and measurable difference
A useful practical translates a psychological question into a safe procedure and a clearly defined outcome.
The proposed question is whether regular and occasional adult members of the same voluntary club differ in a hypothetical allocation favouring their own club. Social identity reasoning suggests that stronger involvement might make group membership more important, but this is a prediction to investigate, not a fact about regular members. Do not use ethnic or religious groups, diagnose participants, or create actual exclusion.
Define regular membership as attending at least four times in the last four weeks, and occasional membership as attending one to three times. Both are pre-existing groups. No attendance is assigned, so any difference could involve age, friendship, time available or another characteristic. The investigation can compare questionnaire responses; it cannot establish that frequent attendance causes favouritism.
One closed item gives an operational measure, a precise rule for recording the outcome: “Imagine a routine event with ten volunteer places. Ten applicants from your club and ten from another club are equally qualified. How many of the ten places would you allocate to applicants from your club? Give a whole number from 0 to 10.” The answer is a discrete quantitative count of hypothetical places. Five represents an equal allocation; above five favours the in-group. It is not an observed allocation, a direct measure of racist prejudice, or a general personality score.
Add an open question: “What considerations mattered to you when allocating those places?” This gathers qualitative reasons that may explain equal counts with different meanings. Someone choosing six might value familiarity; another might have misunderstood equal qualifications. Collecting both forms of data is part of the required practical.
An alternate hypothesis states the predicted difference rather than the absence of a difference. A suitable nondirectional version is: “Regular members, attending at least four times in the last four weeks, and occasional members, attending one to three times, will differ in the number of the ten hypothetical places allocated to their own club.” It states groups and a measurable outcome. A directional version predicts more places for regular members if there is a reason for that direction established before examining the results. Choose the prediction before seeing data, rather than rewriting it to match them.
Constructing and piloting the questionnaire
Question construction determines whether respondents understand the same task and can express an answer that reflects their view.
Use brief neutral instructions explaining that the study concerns decisions in club activities. The questionnaire can contain an attendance count for grouping, the allocation-count item and the open explanation. State that all fictional applicants are equally qualified and all places are identical, so respondents are not inventing differences the researcher did not intend. Give one question at a time, use familiar language and provide enough space for reasons. Avoid a leading item such as “How many places would you fairly give our loyal members?”: “fairly” and “loyal” suggest an approved response. Avoid double questions such as “Are club members reliable and friendly?” because one answer cannot reveal which quality was rated.
A closed question restricts responses and makes counts comparable, but may omit an important reason. An open question permits respondents’ own words and can reveal interpretations, but takes longer to analyse. A ranked response scale, such as five ordered categories from strongly disagree to strongly agree, is a possible closed alternative. Its categories are ordinal; their order does not establish equal numerical distances. It would change the measure from a count of places to a rating, so it should not be substituted silently into the count analysis below.
Pilot the draft with a few consenting adults outside the main sample. Ask whether any wording is confusing, whether the instructions imply a preferred answer and how long completion takes. A short semi-structured interview is useful here: prepare core prompts such as “How did you interpret equally qualified?”, then ask neutral follow-ups where clarification is needed. A structured interview asks the same predetermined questions in the same order, improving comparability but limiting exploration. An unstructured interview follows the respondent’s answers more flexibly, allowing detail but making responses less standardised. The main required practical remains a questionnaire; the pilot interview helps improve it.
Researcher effects can occur in both formats. Smiling approvingly at a generous answer, stressing “our club” or completing the survey beside the club leader may influence responses. Social desirability occurs when respondents present themselves in a favourable way, perhaps giving an equal allocation because they believe that is expected. A neutral script, private self-completion and anonymous answers reduce such pressures without guaranteeing truthful reporting.
Revise unclear items after the pilot and settle the final version before main data collection. Mixing materially different questionnaire versions in the same dataset makes an apparent group difference difficult to interpret.
Sampling and ethical risk management
Sampling and ethics have to be planned together because access to a club does not entitle a researcher to its members’ personal information or participation.
Define the target population as adult members of the chosen club, then obtain appropriate permission to invite them. A random sample selects from a complete, lawfully available sampling frame with each member an equal selection chance, but refusals can still introduce bias. A stratified sample randomly selects in proportion to important population subgroups; for example, if regular and occasional members make up 60% and 40%, a sample of 20 would invite 12 and eight respectively. This preserves their population proportions, but needs accurate group information. A volunteer sample uses an open invitation and may attract unusually interested or inclusive members. An opportunity sample approaches available members, perhaps after a meeting; this is feasible but may systematically miss less frequent attenders. None guarantees representativeness.
For a small supervised practical, an open adult invitation may be the feasible choice. Specify the inclusion criteria, recruitment location and period, record actual group counts, and explain the volunteer limitation. Participation must not be pressured to fill an empty group. If group sizes differ, compare suitable summaries rather than raw totals. Do not call a convenient balanced sample “stratified random” unless selection within the strata really was random and the claimed proportions are correct.
The specification names the BPS Code of Ethics and Conduct (2009). Its principles of respect, competence, responsibility and integrity guide decisions, rather than acting as four boxes that automatically make a procedure ethical. Apply respect through informed voluntary consent, privacy and withdrawal; competence by obtaining supervision and piloting the method; responsibility by anticipating and reducing harm; integrity by explaining the procedure honestly and reporting the results accurately. The original 2009 code is the prescribed historical reference; later editions do not change its specification label.
Before collecting anything, make a risk assessment: identify who might be affected, likely harms, their seriousness, safeguards and a stopping response. Here risks include feeling judged as disloyal, pressure from a leader and identification through a distinctive written story. Use low-stakes fictional decisions, collect no names or unnecessary personal details, allow skipped questions, recruit away from authority pressure and ask respondents not to identify other people. Obtain appropriate gatekeeper approval and each adult’s informed consent; one does not replace the other.
Use a participant-chosen code if answers must remain withdrawable after submission, and explain a realistic withdrawal deadline before anonymised aggregation. Store the dataset securely, restrict access, paraphrase potentially identifying quotations and report only group summaries. Give a debrief stating the purpose and contact route for questions. If the pilot reveals discomfort or an unexpected disclosure risk, change or stop the procedure with the supervisor; do not rely on later debriefing to justify avoidable harm.
Conducting and recording the investigation
A reproducible procedure gives each participant comparable information while keeping their response private.
After supervisor approval and the pilot, prepare the final questionnaire, information sheet, consent process and debrief. Invite eligible adults using the selected sampling method. Explain purpose, expected time, privacy, skipped questions and withdrawal arrangements before consent. Give consenting participants the same neutral instructions and the same fictional allocation scenario. Allow private self-completion without discussion among respondents or observation by club leaders. Answer clarification requests using an agreed neutral explanation, rather than coaching a “fair” answer.
Keep a log of the recruitment period, invitations and responses where it can be done without identifying people. On submission, record only a code, the attendance group, the 0–10 count and the open response. Check whether answers are complete and within the allowed range, using pre-agreed rules: a missing allocation is missing data, not zero; an invalid attendance response cannot be guessed into a group. Record exclusions and their reasons transparently. Allow qualitative data to remain available if an unrelated quantitative item is missing, subject to the agreed analysis and consent.
Do not change the question midway because the results seem uninteresting. Different versions or instructions could create a researcher effect that resembles a psychological difference. If an unexpected ethical problem arises, stop and consult the supervisor. Record the change as a limitation rather than concealing it.
This sequence is a model for conducting the required research. The examples in the next sections are synthetic demonstration data, not responses collected by you or by a real club. A learner carrying out the practical needs a truthful record of their own approved procedure and actual results, including null or ambiguous outcomes.
Describing and presenting the counts
Quantitative analysis should show both the typical allocation and how much individual responses differ.
Use these synthetic demonstration counts of hypothetical places allocated to the respondent’s own club. Each group contains six different people.
| Group | Raw counts, in order |
|---|---|
| Regular | 4, 6, 6, 8, 8, 10 |
| Occasional | 2, 2, 4, 4, 6, 6 |
For regular members, the total is 42, so the mean is . The median is the mean of the third and fourth ordered scores, ; the modes are 6 and 8, and the range is . For occasional members, the total is 24, so mean and median are both 4; the modes are 2, 4 and 6, and the range is . Multiple modes are possible: do not choose one arbitrarily.
For sample standard deviation, , where is each score, is the sample mean and is the number of scores.
The counts have a numerical unit of places, so mean and sample standard deviation are useful here. The regular group’s deviations from 7 are −3, −1, −1, 1, 1 and 3; their squares sum to 22. Thus places to two decimal places. For the occasional group, squared deviations from 4 sum to 16, giving places. The denominator is , not , because the sample statistic is used to estimate variation in the wider member population. The demonstration is synthetic, but illustrates that sample-analysis convention. A single ordinal agreement rating would instead justify caution about assumed equal intervals; it is not the count variable used here.
A frequency table preserves the distribution. Count each score, including zero frequencies, so no response disappears.
| Places allocated | 0 | 1 | 2 | 3 | 4 | 5 | 6 | 7 | 8 | 9 | 10 |
|---|---|---|---|---|---|---|---|---|---|---|---|
| Regular frequency | 0 | 0 | 0 | 0 | 1 | 0 | 2 | 0 | 2 | 0 | 1 |
| Occasional frequency | 0 | 0 | 2 | 0 | 2 | 0 | 2 | 0 | 0 | 0 | 0 |
[DIAGRAM: asset_name: Synthetic club allocation means; asset_slug: edexcel_9ps0_s09_club_allocation_means; recommended_method: deterministic_plot; description: A zero-based bar chart shows the synthetic regular-member mean of seven places and occasional-member mean of four places, on a zero-to-ten scale.; caption: The synthetic sample means differ by three places; the bars do not establish causation or statistical significance.]
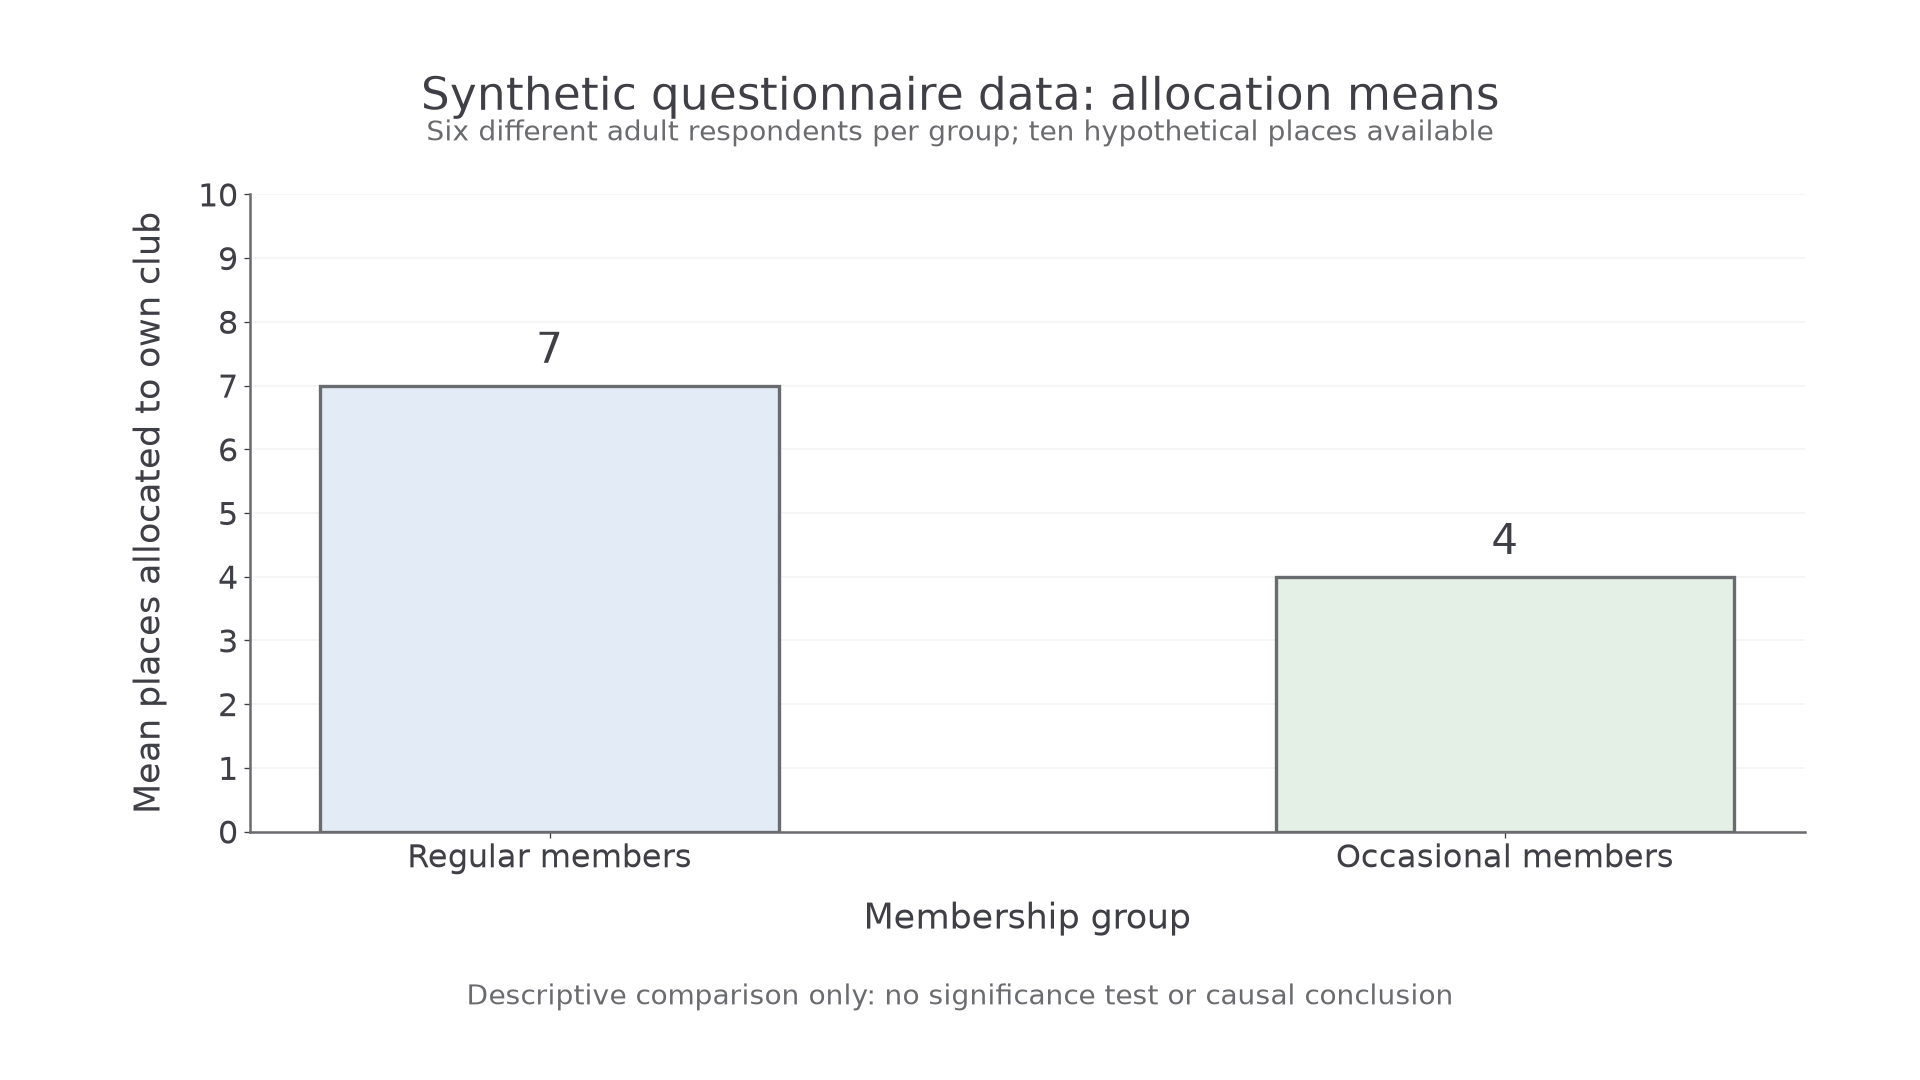
To construct your own bar chart in a notebook, put membership group on the horizontal axis and mean number of places on the vertical axis, starting at zero and showing the full 0–10 possible scale. Use equally wide separate bars, a meaningful title and labels with units. This construction is an ungraded self-check here: check heights 7 and 4 against the table. Reading the supplied chart does not certify that you constructed one.
The regular mean exceeds the occasional mean by three places, and the regular sample is more variable by both range and sample SD. Report this descriptive pattern alongside the overlapping scores and small sample. No inferential test has been conducted, so do not write “significant”, or claim that the hypothesis has been proved. Attendance was not assigned; neither the chart nor an eventual significant result could by itself establish causation.
Making sense of participants’ reasons
Thematic analysis looks for patterns of meaning in open responses while retaining reasons that do not fit the dominant pattern.
Read the responses several times before coding. Mark relevant ideas with brief codes, compare codes across responses, develop candidate themes, and check each theme against both the coded extracts and the complete answers. Refine overlapping themes, define what each includes, name them clearly and report evidence. This is an interpretive process: a theme is a coherent pattern of meaning, not simply the most frequent word.
Three synthetic responses illustrate the procedure. “I know who turns up when we need help” can be coded as familiarity and dependable participation. “They are equally qualified, so belonging should not matter” can be coded as equal eligibility. “I would like people from both clubs to get to know each other” can be coded as building connections. Possible themes are trust through familiarity, fairness beyond membership and connection between groups. Check more responses before deciding those themes adequately represent the dataset.
Keep a codebook with definitions and anonymised examples, and retain a record of how themes were revised. A second researcher can code some responses and discuss differences, which may reveal unclear definitions or the first analyst’s expectations. Agreement does not prove that one interpretation is uniquely true; reflexivity means considering how the researcher’s perspective affects interpretation. Retain contradictory responses and distinguish a theme’s prevalence from its psychological importance. One vivid quote cannot establish what every member believes.
Qualitative findings can challenge the numerical interpretation. A high in-group allocation explained through known reliability may reflect familiarity, not simple dislike of outsiders. Yet the scenario states equal qualifications, so favouring familiar members still deserves investigation. Do not remove inconvenient answers or force every response into “prejudice”. Combine the forms of evidence without claiming that a written reason reveals unconscious motives with certainty.
Reporting results and improving the method
A report separates what was done, what was found and what those findings might mean.
The procedure section records recruitment, inclusion criteria, ethical safeguards, the final questions and instructions, setting, order, recording and exclusion rules in enough detail for a competent researcher to understand the investigation. Describe what actually occurred, including departures from the plan. Preserve the questionnaire as an appendix where appropriate, with private information removed.
The results section presents actual group sizes, raw-data summaries, measures of central tendency and dispersion, the frequency table and bar chart. It also defines themes and supplies anonymised examples. For the synthetic demonstration, it would report means of 7 and 4 places and sample SDs of 2.10 and 1.79, alongside the themes. Do not add an explanation of why participants behaved that way as if it were itself a recorded result.
The discussion interprets the pattern in relation to the hypothesis and psychological ideas. A greater regular-member allocation is consistent with greater in-group identification, but competing explanations include familiarity, self-selection and differences between the pre-existing groups. Self-reported intentions may differ from behaviour, and social desirability may depress apparent favouritism. Small samples and incomplete sampling frames limit generalisation. State whether the pattern supports the prediction descriptively; do not claim a significant difference without the relevant inferential analysis.
Evaluate specific strengths as well as weaknesses. The same scenario and private self-completion improve comparability and reduce face-to-face pressure. Combining counts with open reasons can reveal misunderstandings missed by numbers alone. However, anonymity reduces pressure at the cost of limited opportunities to clarify vague answers, while a short questionnaire is feasible but covers only a narrow form of group-based decision-making.
Propose improvements tied to these problems. A clearer pilot can reduce ambiguous wording. A lawful stratified random invitation with recorded nonresponse can improve representation, though cannot force participation. More than one neutral allocation scenario can broaden measurement, provided scoring is fixed beforehand. Anonymous completion away from leaders can reduce social desirability. Comparing groups more closely on relevant background variables can address some confounds, but remains observational. Wider data collection must remain ethical; greater realism does not justify actual exclusion or deception.
Report negative or mixed findings with the same care as a clear difference. A well-planned practical can teach useful skills even when the data do not support the prediction. Its quality depends on transparent procedure, appropriate analysis and justified limits, not on obtaining the result expected by a theory.