5.3.3 - Kroenke’s PHQ-8 study
A population survey needs a brief, consistent way to measure depression without treating a questionnaire as a complete clinical assessment. Kroenke and colleagues compared two ways of scoring the PHQ-8 and asked whether they described similar levels of depression and everyday impairment.
The population question and design
Kroenke et al. wanted to assess the Patient Health Questionnaire eight-item depression scale (PHQ-8) in the general population and compare its diagnostic algorithm with a simpler total-score cutpoint. Pearson labels the study 2008, its online-publication year; the journal issue appeared in 2009 in the Journal of Affective Disorders, 114, 163–173. These dates identify the same report.
Prevalence
The proportion of a defined population or sample meeting a specified definition of a condition during a specified period. A prevalence estimate depends on both the people sampled and the rule used to count cases.
The researchers analysed the 2006 US Behavioral Risk Factor Surveillance System (BRFSS). Trained interviewers used a standardised telephone questionnaire and random-digit dialling to sample non-institutionalised adults in households with telephones. The optional Anxiety and Depression Module was administered in 38 states, the District of Columbia, Puerto Rico and the US Virgin Islands. The analysis included 198,678 adults who completed every PHQ-8 item. This is not a sample of 198,678 patients already diagnosed with depression.
The design was a cross-sectional population survey: current symptoms and other information were assessed at the survey occasion. The researchers did not manipulate depression, allocate treatments or follow the same participants through recovery. Both scoring rules were applied to each respondent's answers, allowing a within-sample comparison of measurement rules. Calling this comparison an experiment would invent an independent variable manipulated by the researchers.
The survey also collected sociodemographic information and self-reported days of impaired health or activity. Depression scores referred to the previous two weeks, whereas the quality-of-life questions referred to the previous 30 days. The different periods matter when interpreting their association.
The analysed sample was 61.6% women and 78% non-Hispanic White. Probability sampling strengthens the population purpose, but random dialling does not guarantee that every group responds or can be reached. The study later considers these coverage limits.
Two scoring rules for the same answers
The PHQ-8 measures the frequency of eight depressive symptoms, and the study compared the pattern of symptoms with their summed severity score.
The eight domains concern depressed mood, loss of interest or pleasure (anhedonia), sleep, energy, appetite, feelings of worthlessness or failure, concentration, and slowing or restlessness. The PHQ-8 omits the PHQ-9 item about thoughts of death or self-harm. In this telephone-surveillance setting the authors explained that interviewers could not provide adequate intervention after an endorsement. This was a study-specific measurement decision; omission does not establish that the omitted concern is unimportant.
BRFSS asked how many days each symptom had occurred during the last two weeks. Those answers were converted into the questionnaire categories as follows:
| Reported days | Category used in this study | Item score |
|---|---|---|
| 0–1 | Not at all | 0 |
| 2–6 | Several days | 1 |
| 7–11 | More than half the days | 2 |
| 12–14 | Nearly every day | 3 |
The category names and conversions are the authors' operationalisation. Adding the eight item scores produces a score from 0 to 24. The reported severity bands were 0–4, 5–9, 10–14, 15–19 and 20–24. These are dimensional bands of increasing symptom severity; they do not supply a causal explanation.
The diagnostic algorithm used DSM-IV-based symptom rules. For algorithm-defined major depression, at least five symptoms had to be in categories 2 or 3, including depressed mood or anhedonia. For algorithm-defined other depression, two to four symptoms had to reach that frequency, again including one of those two core symptoms. The study's algorithm-defined “any depression” combined major and other depression.
The cutpoint rule instead counted a total score of 10 or more as current depression for this research comparison. It is simpler because it uses one sum, rather than requiring a particular pattern of frequent symptoms.
[DIAGRAM: asset_name: Two PHQ-8 scoring routes; asset_slug: edexcel_9ps0_cl11_phq8_scoring_routes; recommended_method: image_gen; description: The same eight two-week symptom answers feed a symptom-pattern diagnostic algorithm and a summed-score cutpoint in parallel, with a warning that similar population estimates can identify different people.; caption: Two scoring routes use the same PHQ-8 answers, so their agreement is not an independent clinical validation.]
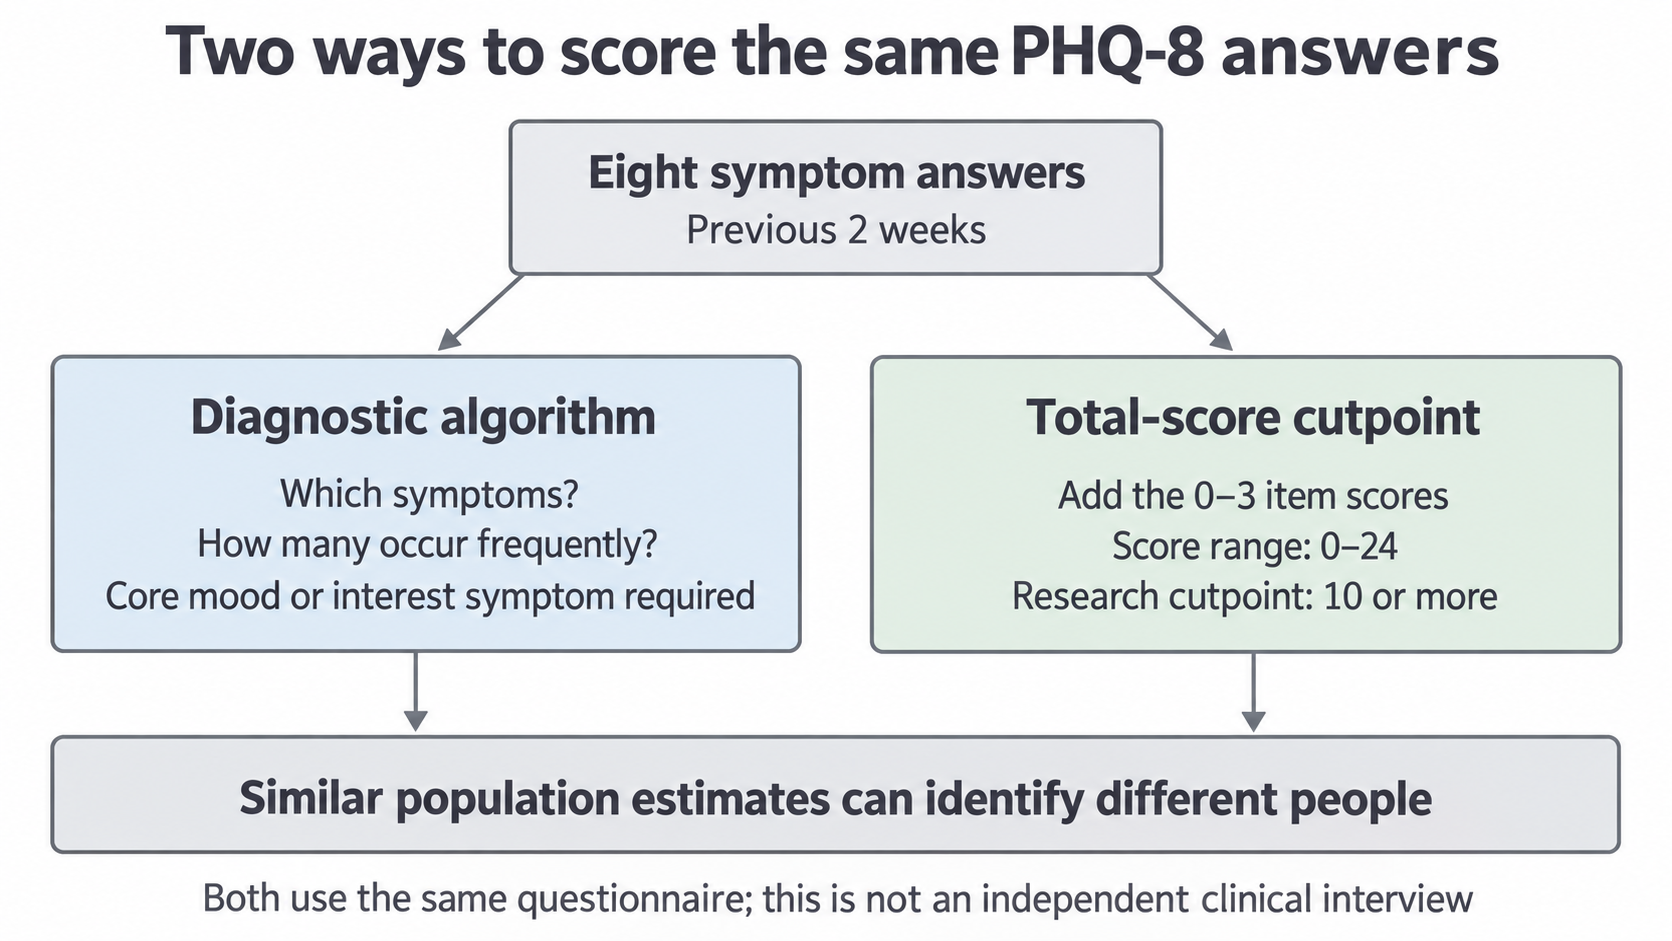
Consider a fictional research response pattern, with scores 1, 1, 2, 2, 2, 2, 0, 0 in the domain order above. Its sum is 10, so it meets the cutpoint. Neither core symptom reaches category 2, so it does not meet either algorithm category. A total and a symptom pattern answer different questions. This is an exercise in the paper's coding rules, not a diagnosis of a person.
Continue this lesson.
You’re previewing NovaLearn without an account. Create a free account to read the rest.
Create free account