Biology 8.11 - Measuring respiration
Use a respirometer to investigate how temperature affects oxygen uptake, then calculate rates and evaluate whether the measurements support a reliable conclusion.
Oxygen uptake as evidence
Respiration happens inside living cells. In the core practical, oxygen uptake is used as evidence that germinating peas are respiring aerobically. The apparatus does not measure released energy directly, and respiration does not create energy; it releases energy from chemical stores for cellular processes such as growth.
A respirometer measures gas change around living material. It must not be confused with a spirometer, which measures air moved into and out of lungs.
The gas change has a precise cause:
- Germinating peas take oxygen from the air in the sealed chamber as they respire.
- Their respiration also releases carbon dioxide.
- Soda lime absorbs the carbon dioxide, so this gas does not replace the oxygen removed from the chamber.
- The amount of gas, and therefore the pressure inside the chamber, falls.
- The greater air pressure outside pushes a coloured marker droplet along the capillary towards the chamber containing the peas.
The direction matters. Movement towards the peas is evidence of a net loss of gas from their chamber. If the temperature and external pressure change, or the apparatus leaks, the marker may also move; the practical therefore needs a water bath, an airtight seal and a control setup.
Respiration rate in this practical
The comparative respiration rate is the distance the marker moves per unit time. With the same uniform capillary in every trial, faster movement indicates faster oxygen uptake. A calibrated capillary can instead give oxygen volume per unit time.
Core practical: measuring respiration rate
Purpose and apparatus
The investigation tests how temperature affects the rate of oxygen uptake by germinating peas. Use a simple respirometer containing germinating peas, soda lime, a cotton-wool barrier, an airtight bung, a capillary tube with a coloured marker droplet and a millimetre scale. A thermometer checks the water-bath temperature; a stopwatch measures time.
[DIAGRAM: asset_slug: biof_respiration_practical_v2; description: Two vertically stacked respirometers: living mealworms above cotton wool and soda lime, and equal-volume glass-bead control, immersed below water-bath level with thermometers, airtight bungs and scaled capillaries. Liquid moves towards the test tube.]
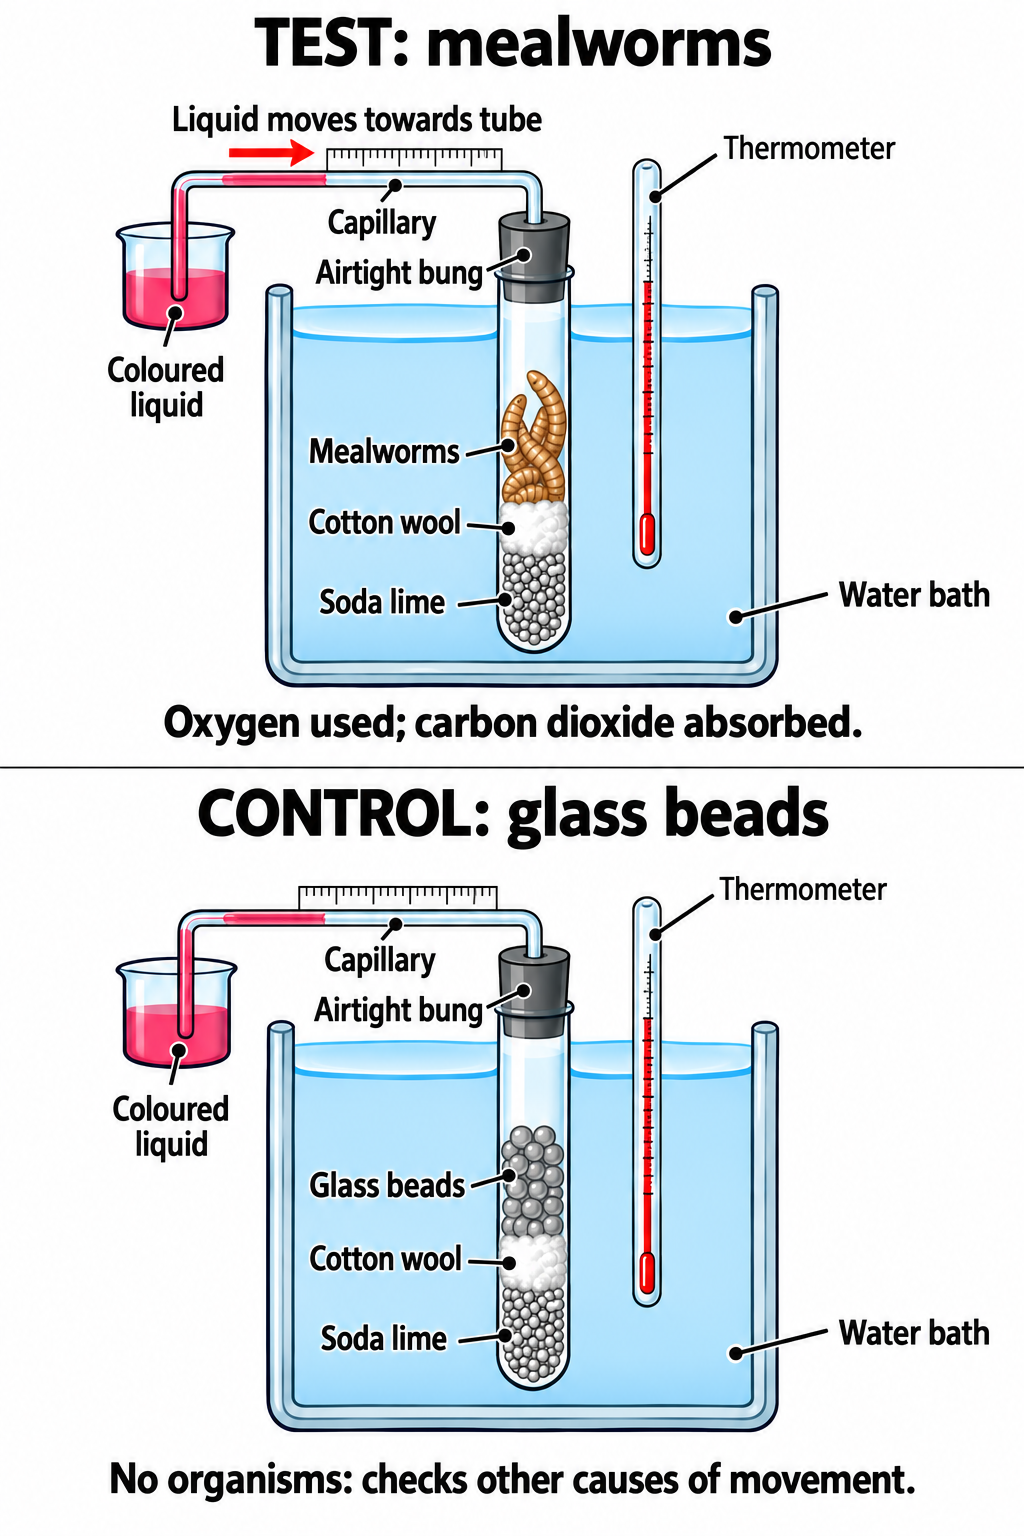
The diagram shows an animal version using mealworms and a capillary connected to a liquid reservoir. The method below uses germinating peas and a marker droplet. Both versions use the same gas-pressure principle; only use an animal version within approved welfare and temperature limits.
Use an otherwise identical control respirometer containing glass beads with the same volume as the peas. Glass beads do not respire. If its marker moves, temperature or air-pressure change, a leak, or handling may be affecting the apparatus; movement in the experimental tube cannot then be attributed confidently to respiration.
Variables
- Independent variable: water-bath temperature, in ; for example , , and .
- Dependent variable: distance moved by the marker in a fixed time, in , processed as a rate in .
- Controlled variables: mass and germination stage of peas, enclosed air volume, amount of soda lime, capillary bore, marker liquid, equilibration time, measurement time and the method used to set the droplet position.
- Control setup: an identical respirometer containing equal-volume glass beads at each temperature. This is an apparatus comparison, not a controlled variable.
Reproducible method
- Wear eye protection. Place a small, equal amount of soda lime in the base of each respirometer tube, then put a cotton-wool barrier above it. The barrier prevents the living material from touching the corrosive absorbent.
- Add an equal mass of germinating peas of the same age above the barrier in each experimental tube. Add the same volume of glass beads to the control tube.
- Fit the airtight bung and scaled capillary. Check the glass is undamaged, push connections together gently, and check joints for leaks using a gentle pressure test before adding living material. A marker need not stay still once organisms are respiring.
- Place the respirometers in the first water bath with the organism-containing region below the external water level, but keep the organisms dry inside the tube. Keep the capillary scale visible. Leave the gas space temporarily open to the atmosphere for at least 5 minutes, until its temperature is stable; then seal the apparatus and set the marker. Use the same equilibration procedure at every temperature.
- Set the marker droplet to a recorded start position. Start the stopwatch and record the distance moved towards the peas after 6 minutes.
- Reset the marker and repeat the measurement twice more with equivalent samples, giving three results at that temperature. Record all results rather than silently discarding one that looks unusual.
- Repeat at , and , allowing the same equilibration procedure each time. Use equal samples and the same measurement time and apparatus dimensions.
Several groups can each use one temperature so that equal samples are tested at the same time. If one set of peas is moved through the temperatures in a fixed order, time since germination and previous warming become confounding variables; separate equal samples or a varied order make the comparison more valid.
Safety and ethical treatment
Soda lime is corrosive: it can damage skin and eyes. Keep it below the cotton wool, handle it with a spatula, wear eye protection and follow the local risk assessment for immediate rinsing and spill response. Capillary tubing can cut if broken, so inspect it, clamp the apparatus securely and never force glass through a bung. Use water baths rather than a flame, and keep temperatures within the planned non-scalding range.
Germinating peas avoid the animal-welfare issues of using small invertebrates. If an approved method uses invertebrates, they must be kept away from soda lime, exposed only to safe temperatures, handled gently and returned promptly to suitable conditions after the investigation.
Why matching sample mass matters
Choose equal starting masses rather than equal numbers of peas, because individual peas differ in size. Mass change can also flag a difference in sample history. A sample changing from to gains . A sample falling from to loses . In each case, divide the change by the starting mass. A mass change alone is not an oxygen-uptake measurement: water uptake or loss can also change mass.
Turning movement into evidence
Record raw measurements before calculating anything. Units belong in table headings so that they do not need to be repeated in every cell.
| Temperature / °C | Distance in 6 min, repeat 1 / mm | Distance in 6 min, repeat 2 / mm | Distance in 6 min, repeat 3 / mm | Mean distance / mm | Mean rate / |
|---|---|---|---|---|---|
| 10 | |||||
| 20 | |||||
| 30 | |||||
| 40 |
The rate relation is:
Rate of marker movement
Worked example: mean rate before an independent check
At , the marker moves , and in three 6-minute trials.
-
Identify the quantities and units: three distances in , each measured over .
-
Calculate the mean distance:
-
Divide by the time:
-
Round sensibly:
to 2 significant figures.
-
Sense-check: at about each minute, a 6-minute movement should be about ; is plausible.
This is a rate of marker movement, used as a proxy for oxygen uptake because every trial uses the same capillary bore. If the capillary is calibrated to give gas volume, use , with a volume-rate unit such as . Do not label a distance as a volume.
Plot temperature on the x-axis and mean rate on the y-axis. Both quantities are continuous, so use a scatter graph with a suitable line or curve of best fit rather than joining every point dot-to-dot. Describe the pattern using values, then explain it: over a safe range, higher temperature increases particle movement and the rate of enzyme-controlled reactions involved in respiration; at temperatures high enough to damage enzymes or the organism, the rate can stop rising or fall.
Evaluating the evidence
- Leak in a bung or joint → pressure difference is lost → marker movement is too small. Improve this by testing airtightness before adding the trial to the results.
- Gas not equilibrated → warming or cooling changes gas pressure → marker movement is not caused only by respiration. Improve this with the same equilibration procedure, checking temperature stability, at every temperature and use the glass-bead control.
- Different mass or germination stage → different numbers or activity of respiring cells → unfair rate comparison. Use equal masses from the same batch and germinated for the same time.
- Marker sticks or its position is read inconsistently → random variation in distance. Use clean uniform capillaries, read the scale at eye level and repeat each temperature before calculating a mean.
An anomalous value should be checked against the method and repeated. Do not remove it simply because it does not fit the expected pattern. A valid conclusion must be based on the data actually collected and should acknowledge a control that moved or repeats that varied widely.
Expressing uncertainty
For repeat marker distances of , and , the range is . The spread describes variation between trials; it is different from the scale resolution. A scale divided into millimetres cannot justify a reading to hundredths of a millimetre. Reading both start and end positions introduces uncertainty into the distance difference. Record the instrument resolution and repeat spread alongside the mean, and avoid claiming that a small difference between means is decisive when the spread is large.
State the temperature range actually tested and whether control markers moved. A conclusion from four measured temperatures should not invent an exact optimum between them. Further readings around the apparent peak would be needed.