Biology 6.12 - 6.13 - Transpiration rates
Light, moving air and temperature change water loss at the leaves and the water taken up to replace it. Use a potometer, calculate rates, and distinguish the measurement from the biological inference.
From water loss to water uptake
Transpiration is the loss of water vapour from a plant, mainly from its leaves. At the scale of a leaf, liquid water evaporates from moist cell surfaces into the leaf air spaces. Water vapour then diffuses out through open stomata.
This loss has an effect beyond the leaf. Water from the xylem replaces water that has left the leaf, so more water is drawn up through the stem and taken up by the plant. This gives the causal chain:
faster evaporation and diffusion from leaves → faster transpiration → faster replacement water uptake through xylem
The rate of transpiration is the amount of water lost in a given time. A moving-bubble potometer measures the rate of water uptake by a cut shoot, not water vapour leaving the stomata directly. Uptake is a useful estimate of transpiration because most of the water taken up replaces water that has been lost, but the two quantities are not exactly identical: a small amount of water can be retained or used in the shoot.
Transpiration happens at leaves; increased transpiration usually causes increased water uptake by the plant.
How the environment changes the rate
The trends below apply when the plant has enough water and the other conditions are kept constant. They describe a normal experimental range, not an unlimited rule: severe heat or water stress can cause stomata to close.
Light intensity
In light, stomata usually open so carbon dioxide can diffuse into the leaf for photosynthesis. Increasing light intensity therefore usually causes wider stomatal opening or keeps more stomata open. More water vapour can diffuse out, so transpiration becomes faster and replacement water uptake increases.
This is not because photosynthesis simply "uses up" all the water that enters. The important link for the rate is the opening of stomata and the resulting loss of water vapour.
Air movement
Water vapour that leaves a stoma builds up in a thin, humid layer of air next to the leaf. Faster air movement carries this moist air away and replaces it with drier air. This maintains a steeper water-vapour concentration gradient from inside the leaf to the surrounding air, so diffusion and transpiration become faster. Water uptake then increases to replace the greater loss.
Air movement does not pull liquid water through the stomata and it does not "blow water out" of the xylem. Its effect is on the air around the leaf and therefore on diffusion.
Temperature
At a higher temperature, water molecules have more kinetic energy. Evaporation from moist leaf-cell surfaces happens more rapidly, and water-vapour molecules diffuse away faster. Transpiration therefore increases over the usual experimental range, which increases replacement water uptake.
The plant is not pumping faster. The immediate change is faster evaporation and diffusion; the change in uptake follows from the extra water loss.
| Change, with other factors constant | Leaf-level mechanism | Expected effect on water uptake |
|---|---|---|
| higher light intensity | stomata are generally more open, so more water vapour can leave | increases |
| faster air movement | humid air beside the leaf is removed, maintaining a steeper concentration gradient | increases |
| higher temperature | water molecules have more kinetic energy, so evaporation and diffusion are faster | increases |
Measuring uptake with a potometer
A moving-bubble potometer makes water uptake visible. A leafy shoot is connected to water-filled tubing with an airtight seal. As the shoot takes up water, a single air bubble moves along a narrow capillary tube towards the shoot. A scale beside the capillary provides the distance moved.
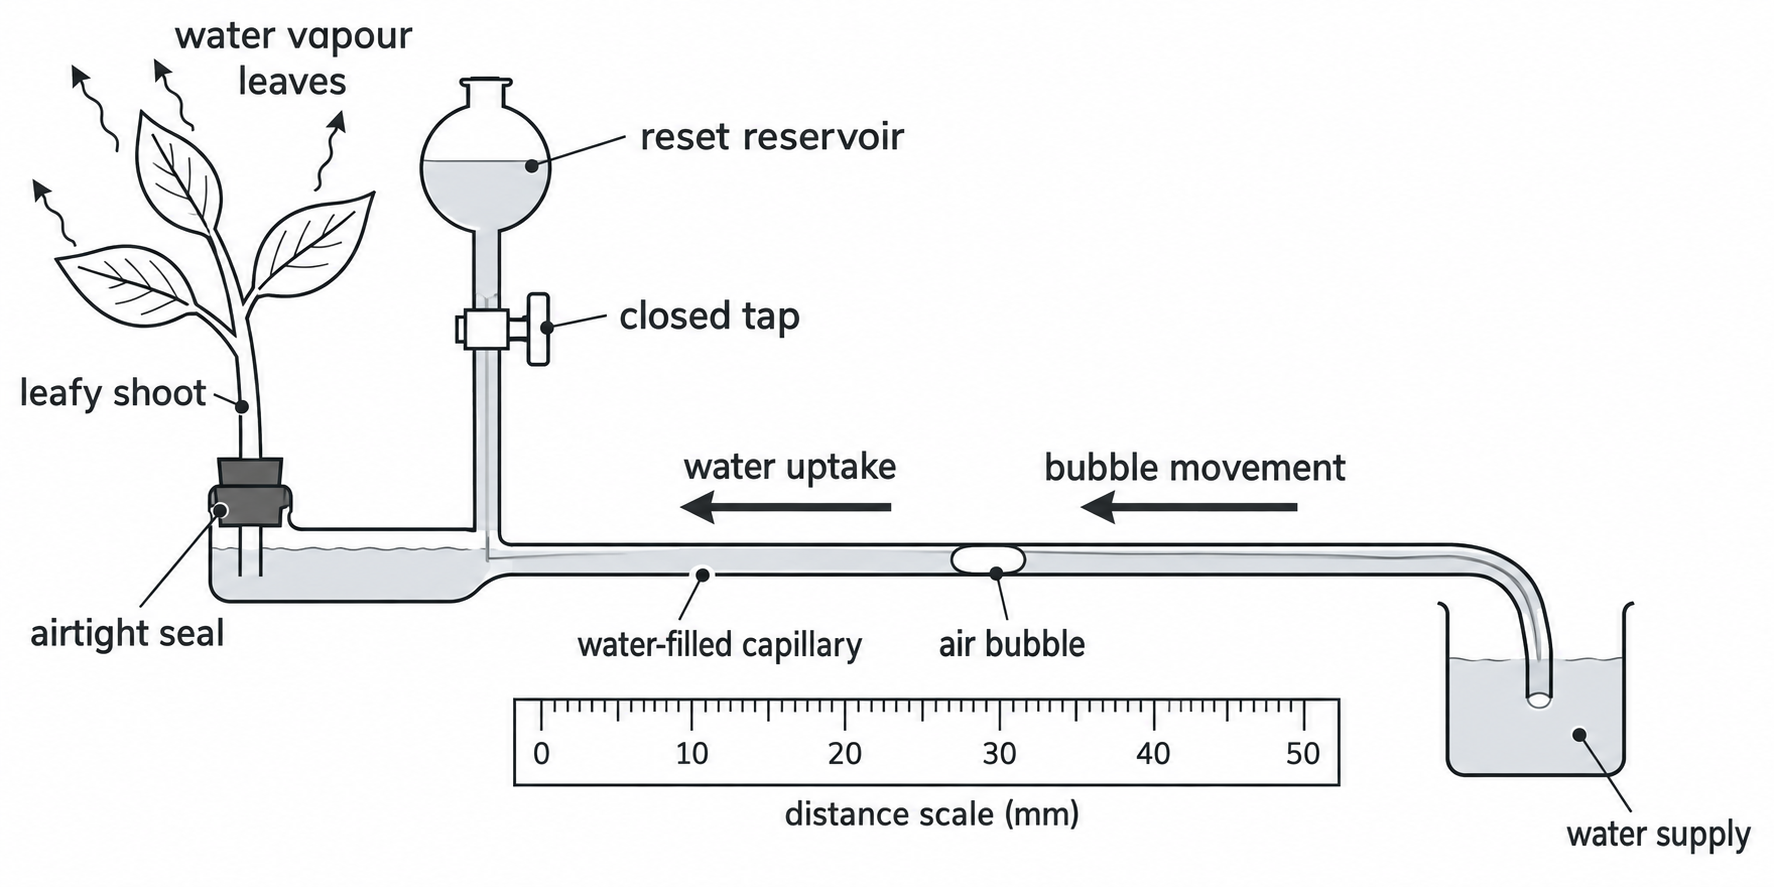
The bubble moves towards the shoot as water is taken up. Close the reset tap while taking measurements.
A workable investigation
- Fill the apparatus with water. Cut the shoot under water and fit it without allowing air into the xylem; an air lock could interrupt water uptake. Make every joint airtight so air cannot enter through a leak.
- Allow the shoot to settle in one set of conditions. Introduce one air bubble into the capillary and record its start position.
- Set one value of the chosen environmental factor. Measure the bubble distance over a fixed time, or measure the time taken to move a fixed distance.
- Reset the bubble with the reservoir, repeat the measurement and calculate a mean. Test several values of the factor while keeping the other conditions constant.
The independent variable is one named environmental factor, such as light intensity, air speed or temperature. The dependent variable is the calculated rate of water uptake. Useful controlled variables include the shoot and its leaf area, plant species, temperature when light is being tested, light intensity when temperature is being tested, air movement when it is not the chosen factor, and the time allowed for the shoot to settle.
Measure the condition at the leaves where possible: place a light meter, thermometer or anemometer at leaf height. Repeating and calculating a mean reduces the influence of random timing or position error. Fragile glass capillary tubing can cut if broken, and a blade used to prepare the shoot can cut skin, so glass should be clamped and handled carefully and shoot preparation should use an appropriate cutting surface and supervision.
What could make the evidence misleading?
- A leak can move the bubble even if the shoot has not taken up that water. Airtight seals address this source of invalidity.
- Air entering the xylem can form an air lock. Cutting and fitting the shoot under water reduces this problem.
- A lamp used to change light intensity can also warm the leaves. A low-heat LED or transparent heat shield, together with checking temperature at leaf height, helps isolate light intensity.
- Different shoots can have different leaf areas. Use the same shoot for a series where workable, or use comparable shoots and account for leaf area.
- Water uptake estimates transpiration rather than measuring water-vapour loss directly, because some absorbed water can be retained or used by the shoot.
Calculating transpiration rates
A rate compares a measured change with the time taken. For transpiration investigations, the change might be bubble distance, volume of water taken up or mass of water lost.
Mean rate
The numerator decides the first part of the unit. Distance divided by time might be measured in ; volume divided by time might be . Convert the time to the unit requested before substitution. A calculated value is an average over that time interval; the instantaneous rate may have varied.
Worked example 1: bubble distance
A bubble moves 42 mm in 210 s. Calculate the mean distance rate in .
- Identify the quantities: change in distance is ; time is . The time is already in seconds, so no conversion is needed.
- Write the relationship: .
- Substitute: .
- Calculate: .
- Sense-check: 0.20 mm each second for 210 s gives 42 mm, so the value and unit are consistent.
This distance rate is useful for repeated readings with the same capillary. If capillary widths differ, equal bubble distances do not necessarily represent equal water volumes, so a calibrated volume rate is better for comparison.
Worked example 2: volume and a time conversion
A calibrated capillary shows that a shoot takes up of water in 12.0 min. Calculate the mean volume uptake rate in .
- Identify the quantities: volume is ; time is .
- Convert the time: .
- Write the relationship: .
- Substitute: .
- Calculate and present: (3 significant figures).
- Sense-check: , recovering the measured volume.
Mass loss as another rate measure
Seal the soil or water reservoir so evaporation from it does not contribute to a plant's measured mass loss. If the mass falls from to in , the water-loss rate is . The percentage loss relative to the starting mass is . A rate describes change per time; a percentage describes change relative to the initial quantity.
For either a gain or a loss, divide the change in mass by the initial mass and multiply by 100. For example, a plant that gains water and rises from to has gained . This measures net mass gain; it does not by itself measure transpiration because water uptake and water loss can occur together.
From rates to conclusions
Raw bubble distances are only directly comparable when the timing and capillary are the same. Calculating a rate puts each observation on a per-unit-time basis.
| Condition | Bubble distance / mm | Time / s | Distance rate / |
|---|---|---|---|
| lower light, still air | 12.0 | 240 | 0.050 |
| brighter light, still air | 30.0 | 240 | 0.125 |
| brighter light, moving air | 39.6 | 180 | 0.220 |
The first two rows differ in light while air remains still: the rate rises from to , an increase by a factor of 2.5. The second and third rows have different recording times, so comparing 30.0 mm with 39.6 mm alone would be misleading. Their rates show that moving air is associated with the higher uptake rate under the stated conditions.
This distinction keeps the reasoning honest:
- Observation: the bubble moved at a calculated rate.
- Inference: the shoot took up water at that rate.
- Conclusion: if other variables were controlled, the changed environmental factor affected uptake and therefore provides evidence about transpiration.
For results from many comparable shoots, a percentile describes position in the ordered measurements. The 90th percentile is the uptake-rate value at or below which about 90% of the measurements lie; it is not a rate of 90% and does not describe a 90% increase. Use comparable samples and conditions when comparing distributions.
For several quantitative values of one factor, place that environmental factor on the horizontal axis and mean uptake rate on the vertical axis. Plot means from repeats, note any anomalous result rather than silently deleting it, and look for a pattern across the range. A conclusion is stronger when repeats are similar and only one factor changed; it is weaker when temperature, light and air movement changed together.
Environmental factors change water uptake by changing water loss at the leaf. Reliable evidence combines a fair comparison with a correctly calculated rate and a cautious link from uptake to transpiration.