Biology 6.5 - 6.6 - Investigating photosynthesis
Measure how photosynthesis rate changes with distance from a lamp. Plan fair comparisons, process oxygen or indicator measurements, and use the inverse-square relationship on Higher tier.
Core practical: changing light intensity
The purpose is to investigate how light intensity affects the rate of photosynthesis in an aquatic plant. A testable prediction is: as measured light intensity increases, oxygen production per minute will increase until another factor limits the rate.
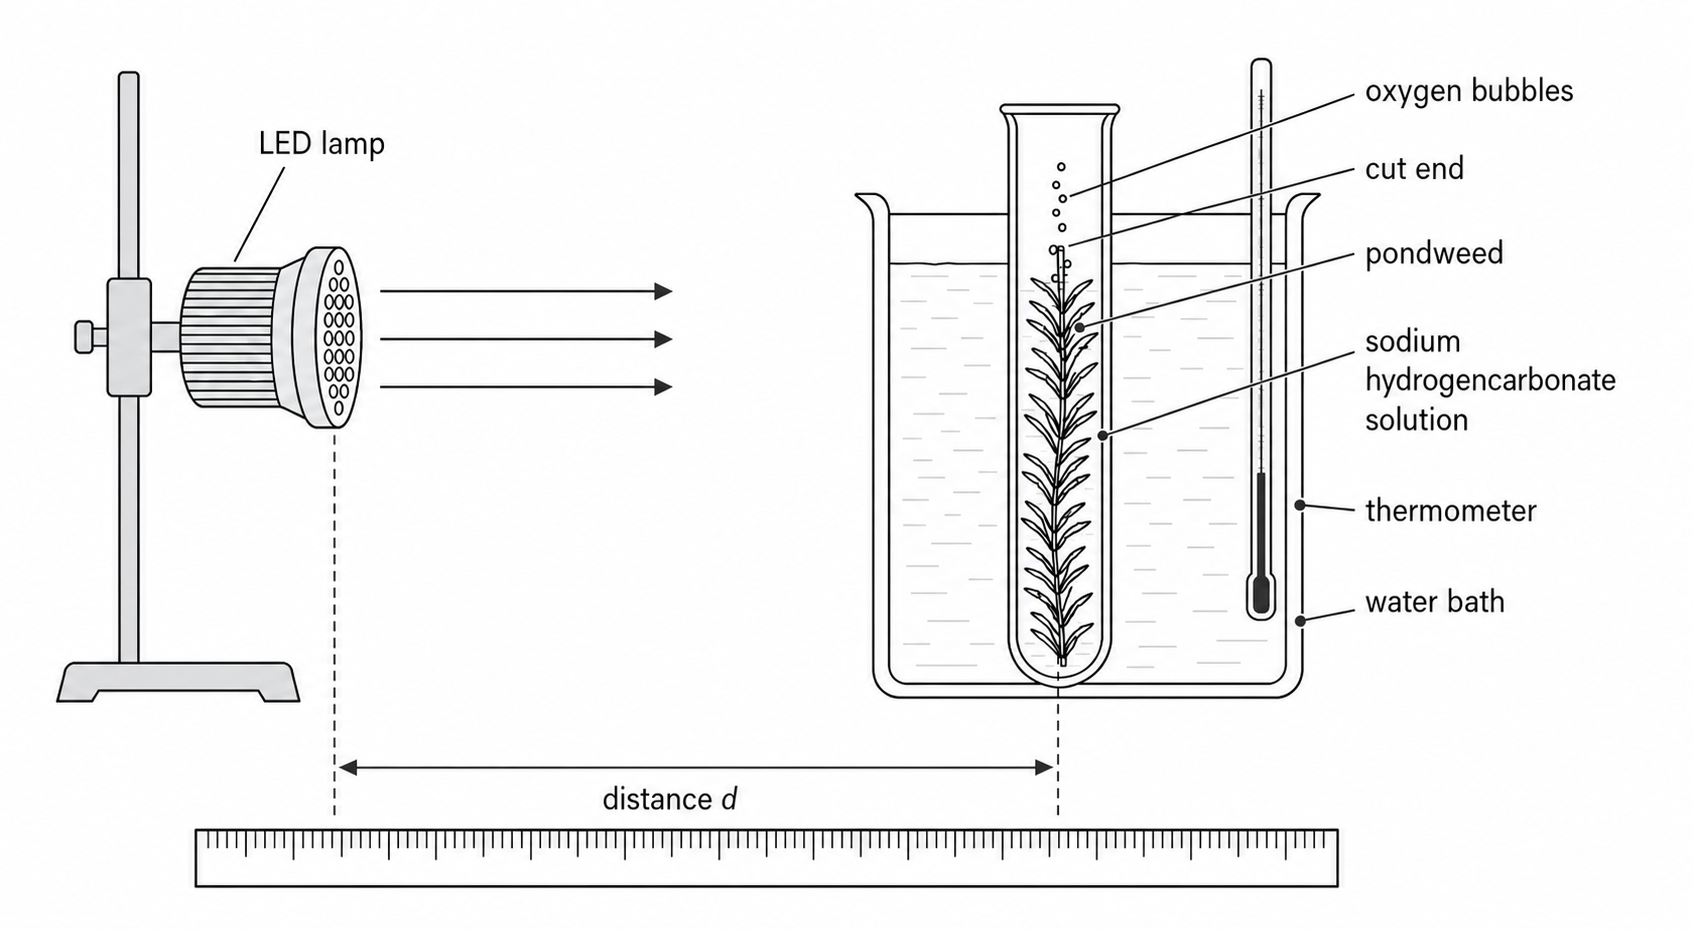
Measure lamp distance from its light-emitting face to the pondweed; control the water temperature.
Use a suitable oxygenating aquatic plant, a boiling tube, of 0.20% sodium hydrogencarbonate solution (0.20 g per ), an LED lamp, ruler, stopwatch, thermometer, water bath and, where available, a light meter. This pondweed setup is a suitable alternative within Pearson's requirement to use algal balls "or similar". Sodium hydrogencarbonate supplies a controlled source of dissolved carbon dioxide.
Variables
- Independent variable: light intensity at the pondweed, changed by moving the lamp and measured in lux with a light meter. If no light meter is available, lamp distance is the manipulated variable used to change light intensity; do not treat equal distance steps as equal light-intensity steps.
- Dependent variable: mean oxygen production rate, first estimated as bubbles per minute. Gas volume per minute is a more valid alternative measurement.
- Controlled variables: the pondweed species and sprig, exposed sprig length, concentration and volume of sodium hydrogencarbonate solution, water temperature, counting time, settling time and background light.
Reproducible method
- Cut a fresh 10 cm pondweed sprig under supervision and place it cut end upward in the boiling tube containing of 0.20% sodium hydrogencarbonate solution.
- Put the boiling tube in a water bath. Place a thermometer in the bath and keep the temperature at throughout.
- Place the LED lamp 10 cm from the pondweed, measuring from the light-emitting face of the lamp to the plant. Put the light-meter sensor beside the tube at pondweed height and record the intensity.
- Leave the setup for 2 minutes so the pondweed adjusts to the new light level.
- Count bubbles leaving the cut end for exactly 1 minute. Record the result.
- Repeat the one-minute count twice more at that light level. Three readings allow a mean to be calculated and make an anomalous count easier to detect.
- Repeat steps 3-6 at 20, 30, 40 and 50 cm, recording the measured light intensity each time. Keep every controlled variable unchanged.
- Calculate the mean oxygen production rate at each distance. Plot mean rate on the y-axis against lamp distance on the x-axis so the required core-practical comparison is explicit. If light intensity was measured, also plot mean rate against measured light intensity.
Keeping the comparison valid
| Control | How to keep it constant | Why it matters |
|---|---|---|
| Aquatic plant | Use the same sprig and keep the exposed length unchanged. | Different amounts or conditions of photosynthetic tissue could change oxygen production. |
| Carbon dioxide | Use of the same 0.20% sodium hydrogencarbonate solution throughout. | Changing carbon dioxide concentration could change the rate. |
| Temperature | Use an LED lamp and water bath; keep the thermometer reading at . | A lamp can heat the water, making temperature a second independent variable. |
| Time | Use the same 2-minute settling time and 1-minute count each time. | Equal intervals make bubble counts directly comparable; otherwise divide each amount by its own time to compare rates. |
| Background light | Use the same room lighting or a simple light shield. | Changing light from other sources would alter the intensity reaching the pondweed. |
Safety and responsible handling
- Water near electrical equipment can cause electric shock or damage. Keep the lamp and leads away from spills, wipe spills promptly, and operate plugs or switches with dry hands.
- A lamp may become hot. Prefer an LED lamp, do not touch the lit surface, and allow it to cool before moving it by hand.
- Pond water may contain microorganisms. Cover cuts, avoid touching the face, and wash hands after handling the plant or water.
- Use scissors away from fingers and handle the living plant gently; return unused suitable material to its maintained aquarium rather than releasing it into the environment.
The algal-ball version of the core practical
Pearson specifies algal balls (or similar) at different distances from a light source, with a measured rate compared against distance. The pondweed method above meets the same requirement by measuring oxygen production. In the algal-ball version, put equal numbers and sizes of algal balls into equal volumes of hydrogencarbonate indicator in identical tubes. Place the tubes at measured distances from the same lamp and keep temperature, starting indicator colour, light exposure time and background light controlled. Include a tube of indicator without algae as a control.
Hydrogencarbonate indicator responds to carbon dioxide: removing carbon dioxide by net photosynthesis makes it more purple; accumulation from respiration makes it more yellow. Time how long each tube takes to reach the same agreed colour, then compare the reciprocal of that time as a relative rate. A colourimeter can make the endpoint less subjective. Do not compare raw final colours after different times as though they were rates. Algae also respire, so this method measures net carbon dioxide change under the test conditions. Repeat each distance and compare the mean relative rate against distance.
For example, the same endpoint reached in and gives relative rates of and : the first is twice as fast. These are comparative indicator rates, not oxygen volumes. Use identical endpoints and conditions for a valid comparison.
Processing and evaluating the evidence
A results table needs headings with units before data are collected:
| Lamp distance (cm) | Light intensity (lux) | Bubbles in 1 min, trial 1 | Trial 2 | Trial 3 | Mean rate () |
|---|---|---|---|---|---|
Repeats do not automatically make a result correct. Compare the readings, repeat an obvious anomaly, and only exclude a value when there is an evidence-based reason such as a timing or counting error. Record any exclusion rather than silently deleting it.
Worked example 1: a mean bubble rate
At one light intensity, the three one-minute counts are 18, 21 and 20 bubbles.
- Quantity: each reading is already a one-minute rate; the mean reduces random counting variation.
- Method: .
- Substitution: .
- Calculation: .
- Final result: to 3 significant figures.
- Sense-check: 19.7 lies between the lowest and highest readings, so the mean is plausible.
Worked example 2: rate from oxygen volume
Suppose a gas-collection tube records of oxygen in 4.0 minutes.
Rate of oxygen production
- Units: volume is in and time is in minutes, so rate will be in .
- Substitution: .
- Calculation: .
- Sense-check: each minute would give in four minutes, so the result is consistent.
For the required core-practical comparison, plot mean oxygen production rate on the y-axis against lamp distance on the x-axis. Use a sensible linear scale, plot each point accurately and draw an appropriate smooth trend rather than joining every point dot-to-dot; the rate should generally fall as distance increases. If a light meter was used, also plot mean rate against measured light intensity. A rising rate-intensity trend supports the conclusion that increasing light intensity increases the rate over that range, while a plateau shows that another factor has become limiting.
Bubble counting is quick but assumes bubbles are equal in volume. Collecting and measuring oxygen volume over a fixed time directly addresses that limitation. Other specific improvements are to use an LED and water bath to prevent temperature drift, shield the setup from changing background light, measure every lamp distance from the same reference points, and use a light meter rather than assuming distance itself is light intensity.
Choosing and reading a graph
Distance and light intensity are continuous measurements, so use a scatter plot and a suitable line or curve of best fit. A correlation describes the direction of the pattern; it does not by itself show which variable caused it. Controlled conditions provide the causal evidence here. For categories such as different plant species, a bar chart is more suitable. If repeated counts are grouped into numerical intervals, use a frequency table and a histogram with touching bars; bar height represents frequency only for equal-width intervals. Sample comparable sprigs fairly instead of choosing only those that fit the prediction.
For example, eight repeated one-minute bubble counts are 12, 14, 14, 17, 18, 18, 19 and 22. Choose equal-width intervals and tally each reading once:
| Bubble count in one minute | Frequency |
|---|---|
| 10 to less than 15 | 3 |
| 15 to less than 20 | 4 |
| 20 to less than 25 | 1 |
A histogram places these numerical intervals on the horizontal axis with touching bars of heights 3, 4 and 1. The most frequent interval is 15 to less than 20, containing four of the eight readings. For a bar chart comparing plant species, put species on the horizontal axis, mean oxygen-production rate on the vertical axis, and leave gaps between the bars because the species are separate categories.
To sample sprigs, first define the plants to which the conclusion should apply. Select several comparable, healthy sprigs without choosing by their apparent rate; number the available sprigs and use random numbers if selection is needed. Repeating one sprig estimates variation in its measurement, while sampling several sprigs also reveals biological variation. A larger representative sample reduces the influence of unusual individuals, but increasing sample size does not repair a biased selection.
Light intensity and the inverse-square law
Higher tier only
For a point-like light source under ideal conditions, light intensity is inversely proportional to the square of distance from the source:
Inverse-square relationship
This means doubling the distance gives one quarter of the light intensity, while tripling the distance gives one ninth. Distance units must be consistent on both sides of the ratio, so centimetres may be used without converting to metres when both distances are in centimetres.
The specification also links rate directly to light intensity. While light is the limiting factor and other conditions are controlled, doubling light intensity is expected to double the photosynthesis rate. Combining the two relationships gives:
where is the rate at distance and is the predicted rate at distance .
Worked example: relative intensity from distance
Some questions define relative light intensity in arbitrary units using , with entered in centimetres. Follow the convention stated in the question or established by its table; these values are not light-meter readings in lux.
For a lamp distance of under that convention:
Square the distance first, then take its reciprocal. The physical relationship is proportionality: . The lamp and choice of units determine the proportionality constant; it is not universally one. Ratios, such as the calculation below, compare two distances without needing that constant.
Worked example: predicting a new rate
A pondweed produces when a lamp is 20.0 cm away. Predict the rate at 40.0 cm, assuming light remains the only limiting factor.
- Meaning and conditions: greater distance lowers intensity; direct proportionality between intensity and rate applies only while light remains limiting.
- Relationship: .
- Substitution: .
- Evaluate the distance factor: .
- Calculate: .
- Final presentation: to 3 significant figures.
- Sense-check: the distance doubled, so intensity and predicted rate should fall to one quarter; one quarter of 32.0 is 8.00.
A real bench lamp is not a perfect point source. Background light, reflection and the finite size of the lamp can make the inverse-square model approximate. More importantly, once a graph reaches a plateau, light is no longer limiting and rate is no longer directly proportional to intensity.