Biology 4.2 - 4.3 - Natural selection and resistance
Natural selection changes inherited characteristics in a population over generations. Follow variation, selection and reproductive success, then use antibiotic-resistant bacteria as observable evidence supporting Darwin’s mechanism.
Darwin's mechanism of natural selection
Evolution is a change in the inherited characteristics of a population over successive generations. Natural selection is the mechanism proposed by Charles Darwin that can produce this change. It acts on differences already present among individuals; it does not transform an individual because that individual needs to change.
Natural selection
The process in which individuals with inherited characteristics that suit the environment are more likely to survive and reproduce, so those characteristics become more common in later generations.
The mechanism has an ordered causal chain:
- Variation exists. Individuals in a population are not identical. Some of this variation is inherited because it results from differences in genes, including new variants produced by mutation.
- There is a selection pressure. Food may be limited, predators may hunt, disease may spread or conditions may change. Not every individual survives and reproduces equally.
- Some inherited characteristics give an advantage. In that environment, their possessors are more likely to survive long enough to reproduce successfully.
- The advantage is inherited. These individuals tend to have more offspring, and their offspring can inherit the advantageous gene variant.
- The population changes. Over many generations, the advantageous inherited characteristic becomes more common. This population-level change is evolution.
Imagine beetles that vary in shell thickness. If birds more easily break thin shells, bird predation is the selection pressure and shell thickness is the inherited feature on which selection acts. Beetles with an inherited thicker shell are more likely to survive and leave offspring. If their offspring inherit that tendency, thick shells become more common over generations. The beetles did not thicken their shells in response to attack; the population changed because some existing variants reproduced more successfully.
"Fittest" therefore means best able to survive and reproduce in a particular environment, not necessarily strongest, fastest or largest. A feature that is helpful in one environment may be neutral or harmful in another.
Showing variation and selection with frequencies
A frequency is how many observations fall in a category or interval. In an illustrative beetle population, shell thickness is known to have an inherited component. The 20 measured thicknesses before bird predation are, in millimetres:
0.12, 0.14, 0.16, 0.18, 0.21, 0.22, 0.24, 0.25, 0.26, 0.27, 0.28, 0.29, 0.31, 0.32, 0.33, 0.35, 0.37, 0.39, 0.42, 0.46.
To construct a frequency table, choose non-overlapping intervals and count each observation once. The first interval includes 0.10 but excludes 0.20; a value exactly on 0.20 would enter the next interval. Counting the first four values gives a frequency of four for the first interval. The other counts are eight, six and two, which sum to 20.
| Shell thickness (mm) | Frequency before predation | Frequency among survivors |
|---|---|---|
| 4 | 1 | |
| 8 | 2 | |
| 6 | 4 | |
| 2 | 2 | |
| Total | 20 | 9 |
Shell thickness is continuous numerical data, so grouped frequencies can be shown as a histogram. Put the thickness intervals on a continuous horizontal scale. The bars touch because the intervals meet. With these equal interval widths of , bar height can show frequency directly: use vertical ticks 0, 2, 4, 6 and 8. Draw each bar across its whole interval to the table's frequency. If interval widths differed, frequency alone would not be a suitable bar height; the area would have to represent frequency.
[DIAGRAM: asset_name: Shell thickness before predation and among survivors; asset_slug: bio_c_shell_thickness_histograms_v1; recommended_method: deterministic_plot; description: Two vertically stacked equal-width histograms with shared 0.10 to 0.50 millimetre thickness scale and zero-based frequency scale. Before frequencies 4,8,6,2; survivor frequencies 1,2,4,2.]
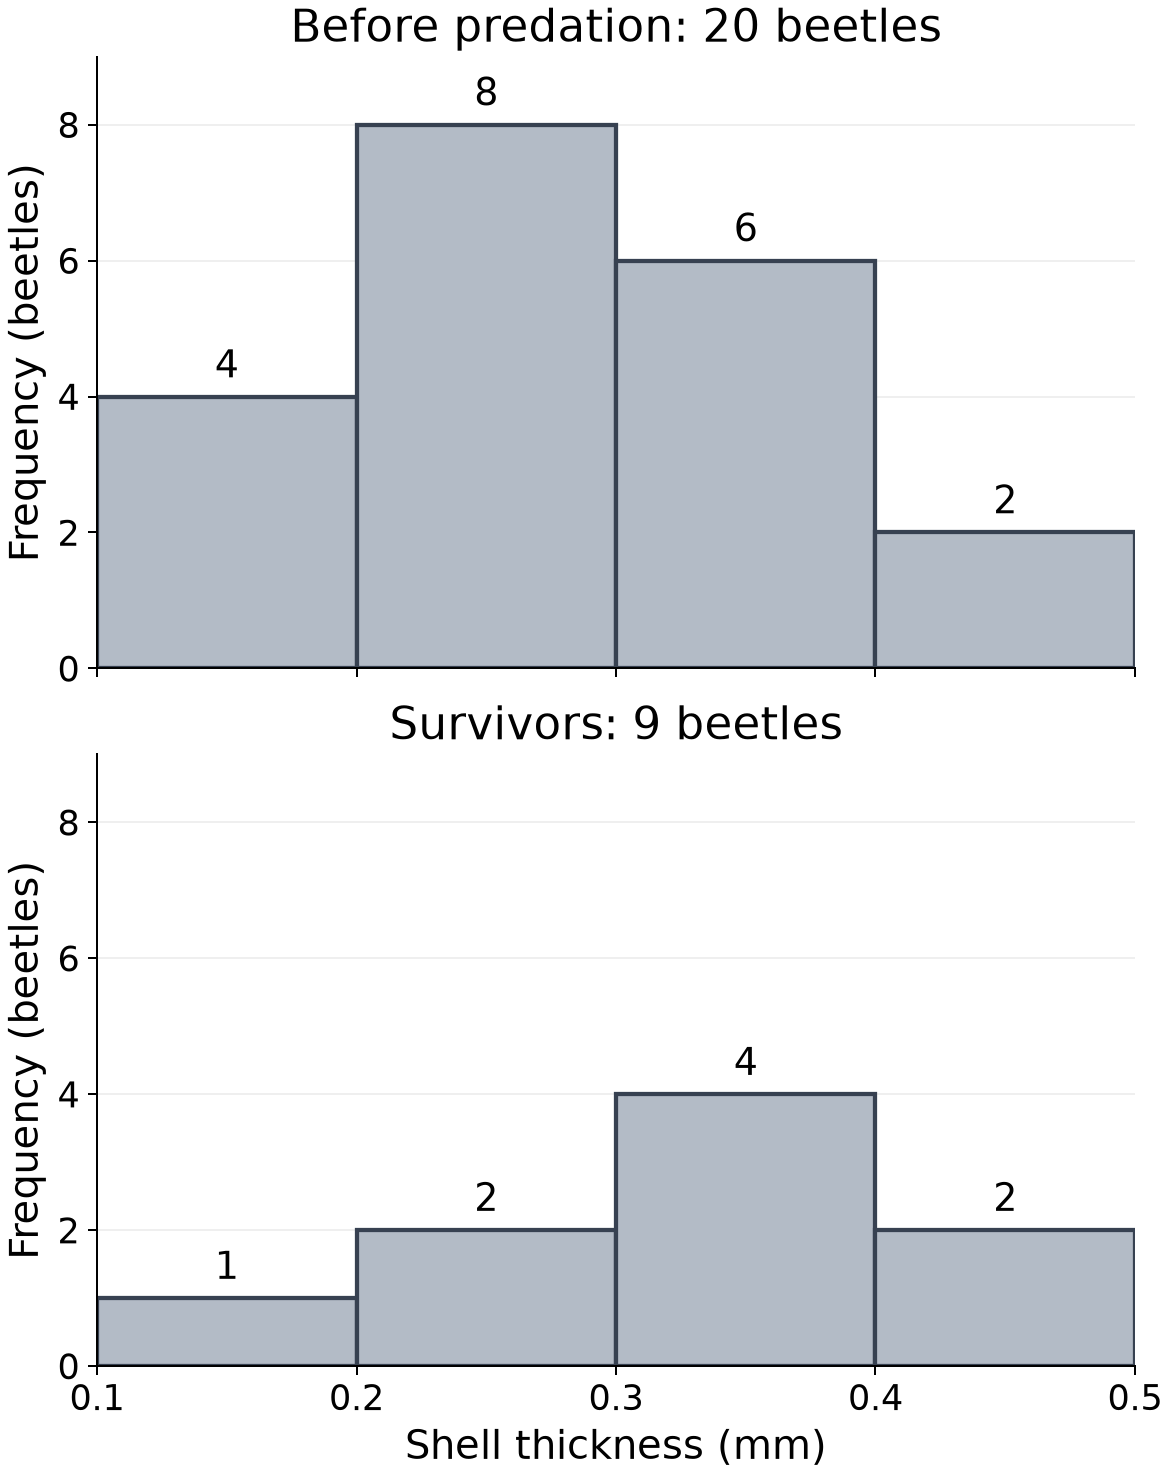
The most frequent interval changes from before predation to among survivors. Read the heights to recover frequencies of eight and four respectively. Both beetles in the thickest interval survive, compared with one of four in the thinnest. The survivors are therefore biased towards thicker shells, consistent with a survival advantage. This is evidence of selection, not evidence that an individual grew a thicker shell after attack. Reproduction and inheritance must still occur for the changed proportions to persist into later generations.
Natural selection needs inherited variation, a selection pressure, unequal reproductive success and enough generations for the population to change.
Antibiotic resistance as observed evolution
A bacterial population may contain genetic variation before it meets an antibiotic. A random mutation can make a bacterium resistant, meaning the antibiotic no longer kills it or stops its growth effectively. The mutation is not produced because the bacterium anticipates or needs the drug.
When the antibiotic is applied, it becomes a selection pressure:
- susceptible bacteria are killed or prevented from reproducing;
- resistant bacteria are more likely to survive;
- the survivors reproduce, passing resistance to their offspring;
- after repeated generations, resistant bacteria make up a larger proportion of the population.
The antibiotic does not make a person resistant, and it does not deliberately teach a bacterium to resist. It changes which bacterial variants survive and reproduce. Misuse and overuse of antibiotics increase selection for resistant bacteria and give them more opportunities to spread.
This supports Darwin's theory because it matches the theory's prediction in an observable sequence: inherited variation exists, an environmental pressure causes unequal survival and reproduction, and the population changes over generations. Darwin did not know the molecular details of mutation, but the observed outcome fits his natural-selection mechanism.
Categories need a bar chart
A second illustrative investigation tests 100 bacterial isolates before antibiotic exposure and another sample of 100 after exposure and several generations of reproduction. Each isolate is classified once as resistant or susceptible.
| Sample | Resistant frequency | Susceptible frequency | Total |
|---|---|---|---|
| Before exposure | 12 | 88 | 100 |
| After exposure and reproduction | 72 | 28 | 100 |
These are named categories, so use a bar chart, leaving gaps between the categories. A histogram would wrongly suggest a continuous numerical interval from “resistant” to “susceptible”. Put the category names on the horizontal axis, frequency on the vertical axis, and use a key to distinguish samples. A zero-based vertical scale with ticks every 20 isolates includes the largest count of 88. For each category, draw the two sample bars to their listed frequencies.
[DIAGRAM: asset_name: Resistant and susceptible bacterial frequencies; asset_slug: bio_c_resistance_bar_chart_v1; recommended_method: deterministic_plot; description: Grouped bar chart with resistant and susceptible categories. Before frequencies 12 and 88; after frequencies 72 and 28, each sample total100. Gaps separate categories and a key distinguishes samples.]
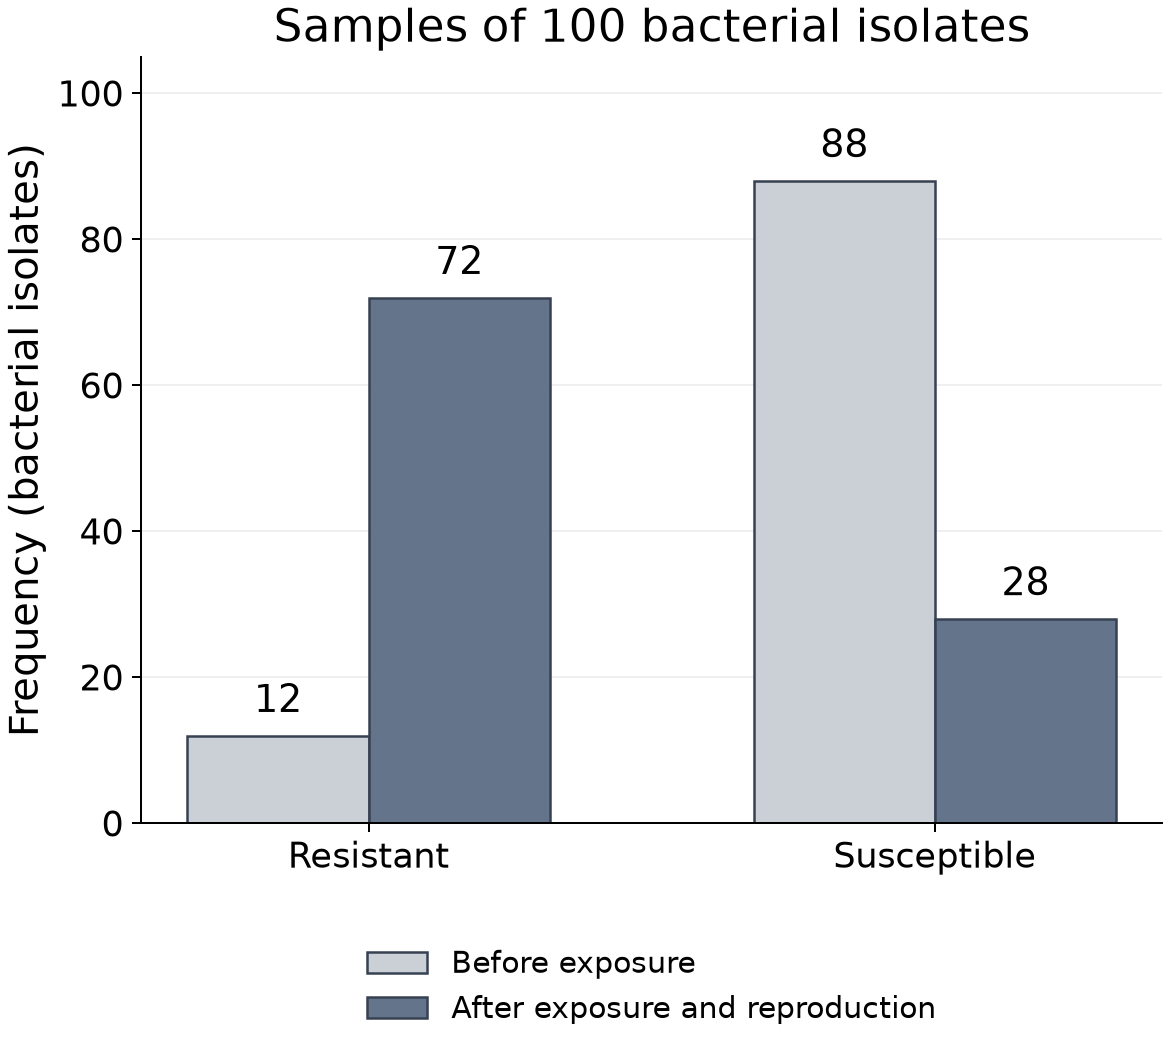
Reading the resistant bars gives 12 before and 72 after. Since each sample contains 100 isolates, these are and , an increase of 60 percentage points. Equal sample sizes make the counts directly comparable; with different sample sizes, compare proportions or percentages instead. The pattern supports selection and reproduction of resistant bacteria. The chart alone cannot show that the antibiotic created resistance or that 60 individual bacteria changed from susceptible to resistant.