Biology 2.7 - Growth charts
Use percentile charts to monitor growth over time, translate between tables and graphs, and calculate percentage mass gain or loss without confusing it with percentile rank.
Reading a percentile from one measurement
A percentile chart compares a measurement, such as height or mass, with measurements from an appropriate reference group. In a child growth chart, the comparison must use the correct age and the appropriate reference chart; clinical charts commonly use separate reference data for sex.
The meaning of a percentile is about rank:
- the 9th percentile means that about 9% of the reference group are at or below that measurement and about 91% are above it;
- the 50th percentile is the middle, or median, so about half are at or below and half are above;
- the 91st percentile means that about 91% are at or below and about 9% are above.
The 50th percentile is not a target. A measurement on the 75th percentile is also not "75% of the expected measurement"; it describes position within a reference distribution.
To use a percentile chart for one measurement:
- Check what the axes measure and their units.
- Find the age on the horizontal axis.
- Find the measurement on the vertical axis.
- Locate the point where those two coordinates meet.
- Read the labelled percentile curve through the point, or state that the point lies between two curves. Do not invent an exact percentile when the chart does not support one.
[DIAGRAM: asset_slug: bio_b_growth_percentiles_v2; description: Portrait fictional height chart with 9th, 50th and 91st curves; open circles show Learner A measurements at ages 10 to 14.]
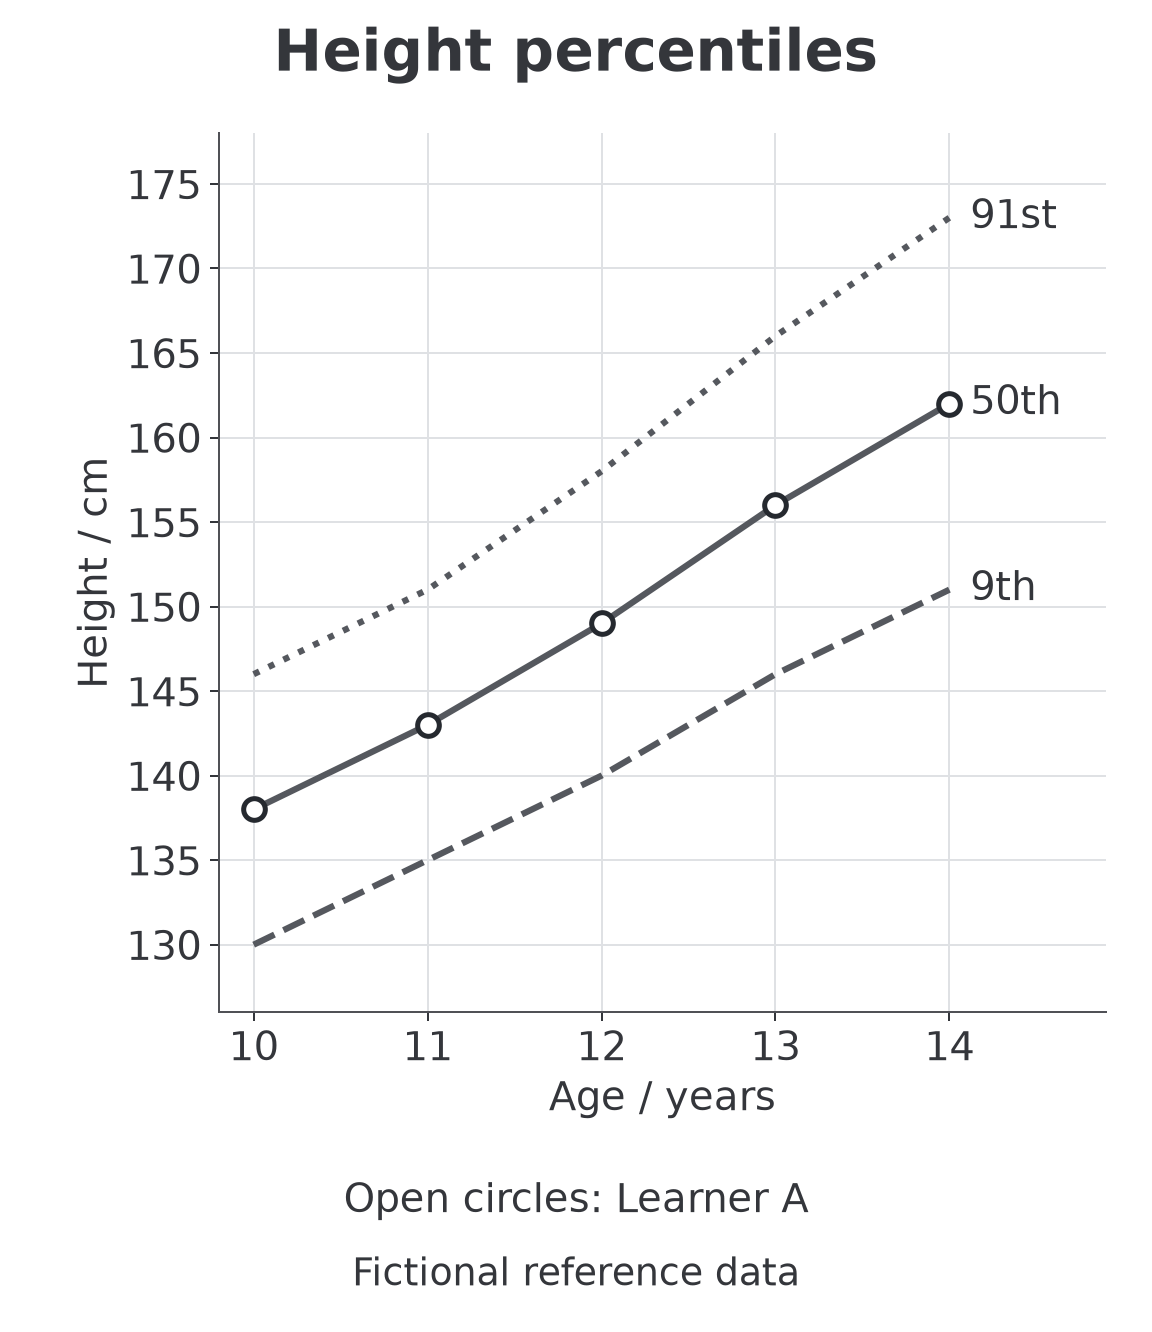
The values used to draw the chart are shown below. Read across a row to plot an age and height; read back from a plotted point to recover its numerical value.
| Age / years | 9th / cm | 50th / cm | 91st / cm | Learner A / cm |
|---|---|---|---|---|
| 10 | 130 | 138 | 146 | 138 |
| 11 | 135 | 143 | 151 | 143 |
| 12 | 140 | 149 | 158 | 149 |
| 13 | 146 | 156 | 166 | 156 |
| 14 | 151 | 162 | 173 | 162 |
Use age on the horizontal axis and height on the vertical axis, choose even scales, and label the units. Place each measured point at its coordinate pair. The labelled lines are reference curves; the open circles are one learner's measurements. A curve is not a line of best fit through this learner's results.
Worked example: one point
Learner A is 12.0 years old and has a height of 149 cm. Determine the percentile shown by the chart and interpret it.
- Check units: the chart uses years and centimetres, so no conversion is needed.
- Plot/read the coordinates: move up from 12 years and across from 149 cm.
- Identify the curve: the point lies on the 50th percentile curve.
- Interpret the rank: about 50% of the reference group at that age are at or below 149 cm.
- Find the percentage above: , so about 50% are above 149 cm.
Sense-check: a middle curve should divide the reference group into two roughly equal halves. The result does not mean that Learner A has reached only 50% of an ideal height.
Monitoring growth over time
One measurement gives a position at one time. Monitoring means plotting accurate measurements at different ages and examining the pattern relative to the percentile curves.
Worked interpretation: repeated measurements
The five Learner A dots on the chart show heights of 138, 143, 149, 156 and 162 cm from ages 10 to 14.
- Every height point lies close to the 50th-percentile curve.
- The raw height has increased by .
- The percentile position has stayed similar, so Learner A has remained near the middle of this fictional reference distribution while growing.
Sense-check: a stable percentile does not mean no growth. The measurement can increase while the person's relative position among same-age peers stays similar.
The reverse distinction also matters. A height can increase while its percentile falls. That would mean the person became taller, but their measurement increased more slowly over that interval than the reference curves. It would not mean that the person shrank.
Growth charts are monitoring tools, not explanations of cause. A sensible interpretation uses:
- repeated measurements rather than a conclusion from one point;
- accurate, consistent measurement methods and appropriate equipment;
- the same appropriate reference chart;
- other biological and clinical information before making any judgement about health.
A single point may be affected by measurement error. Even an accurate pattern shows comparison with a reference group; the chart alone cannot diagnose a condition or explain why a pattern occurred.
Percentage gain and loss of mass
A percentile is a rank among other organisms. Percentage change in mass compares one organism's final mass with its own initial mass. These answer different questions.
Percentage change
Use the same units for both masses. A positive result is a gain; a negative result is a loss. To report a percentage loss as a positive amount, subtract final from initial in the numerator.
Worked gain
A seedling increases from to . Its gain is . Relative to the initial :
Worked loss
A stored plant organ decreases from to . The loss is again , but the initial mass is now different:
The equal mass changes give different percentages because the starting masses differ. Always divide by the initial mass, not the final mass or the mass change. A loss of measured mass could reflect water loss; the calculation alone does not identify its biological cause.
An estimate is useful for checking scale before an exact calculation. A rise from to is roughly a rise from to , so expect a gain near . The exact calculation gives about . An estimate checks whether an answer is plausible; use the original readings when an exact answer is requested.
What growth data can show
At the cell scale, division increases cell number, plant-cell elongation increases length, and differentiation produces specialised tissues. At the organism scale, height and mass measurements record the outcome. A percentile compares a measurement with a reference group; percentage mass change compares it with its own earlier value.
A chart alone cannot show which cell process caused a growth pattern. Nor does it establish whether an individual is healthy. Check repeated accurate measurements, the appropriate reference group and additional biological information before drawing a conclusion.