Biology 7.9, 7.13 - 7.17 - Blood glucose and diabetes
Blood glucose control keeps cells supplied with glucose despite meals and activity. Follow insulin and Higher-tier glucagon, compare the two types of diabetes, and use BMI and waist:hip evidence without confusing risk with diagnosis.
Homeostasis and blood glucose
The conditions outside and inside the body keep changing. Eating can increase the amount of glucose entering the blood, while exercise and time without food can increase the rate at which glucose is removed. External temperature also changes, and activities inside the body continually produce heat and waste.
Homeostasis
Homeostasis is the maintenance of a stable internal environment in response to internal and external change.
"Stable" does not mean perfectly fixed. A homeostatic variable moves within a narrow normal range, and control systems act when it moves too far in either direction. The internal environment includes the blood and the tissue fluid surrounding body cells, so its conditions directly affect those cells.
Keeping conditions within suitable ranges matters because cells depend on enzyme-controlled reactions. They need enough glucose for respiration to transfer energy, but persistently high or very low blood glucose disrupts normal cell and organ function. Homeostasis therefore allows cells to keep working even while the body's surroundings, food intake and activity change.
Many homeostatic systems use negative feedback:
- a variable moves away from its normal range;
- the change is detected and a control signal is produced;
- effectors cause a response that opposes the original change;
- the variable returns towards its normal range, so the corrective response reduces.
Blood glucose control follows this pattern. The regulated variable is the concentration of glucose in the blood, not the total amount of glucose in the whole body.
Insulin lowers blood glucose
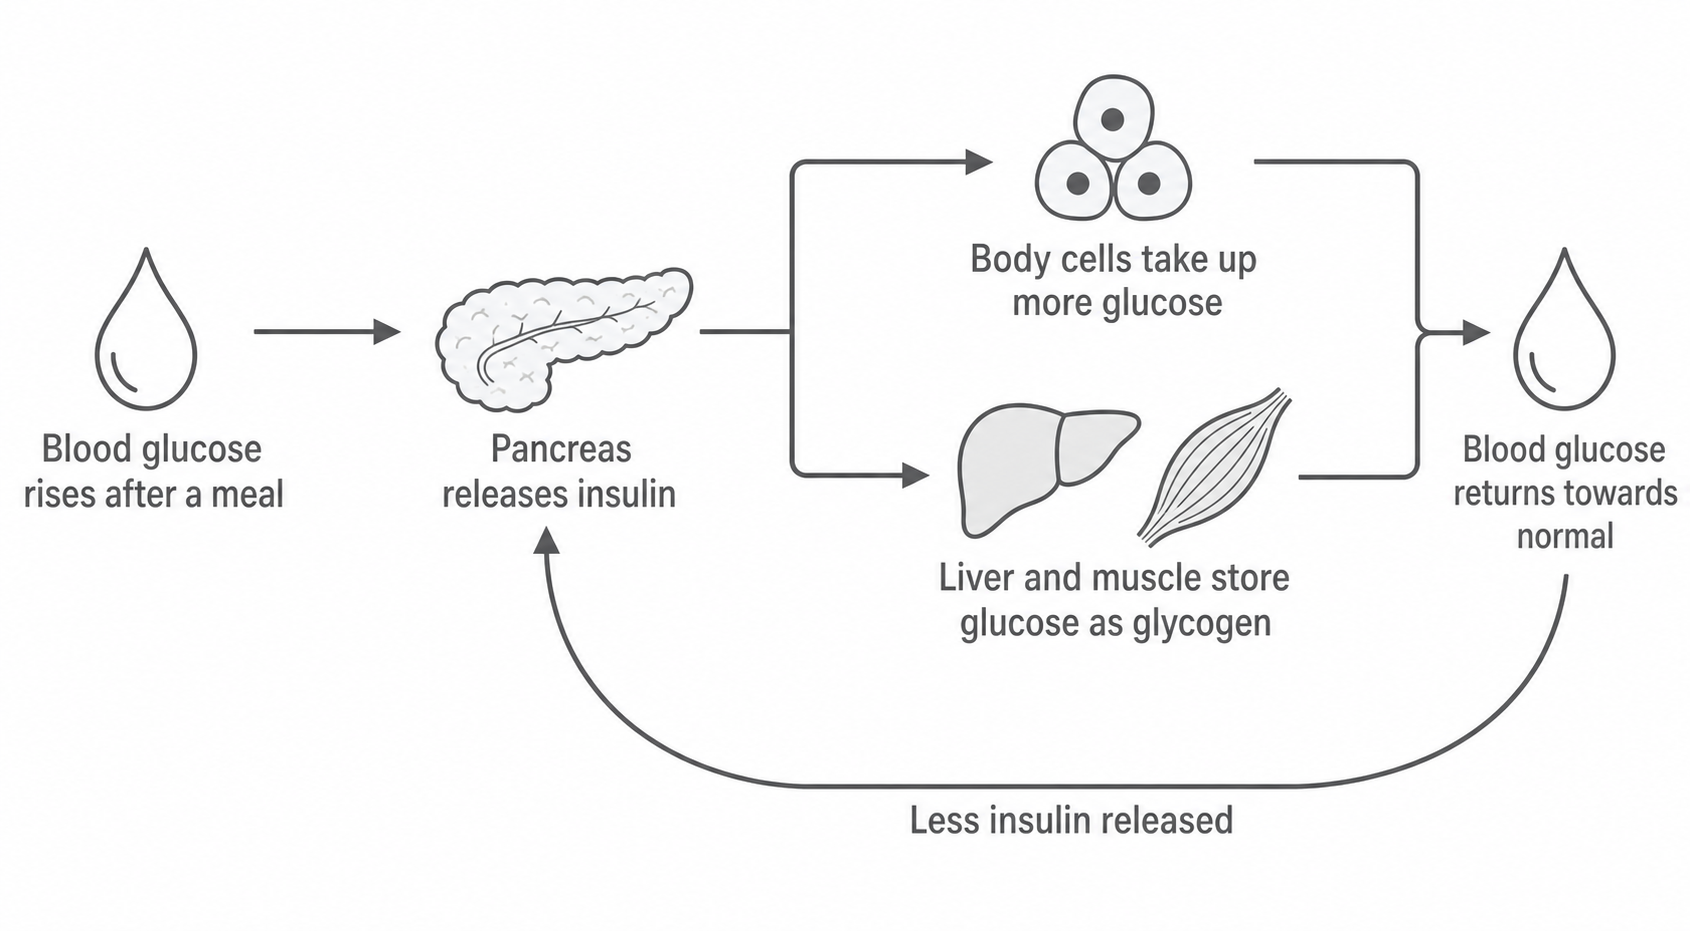
After a carbohydrate-containing meal, digestion produces glucose and glucose is absorbed into the blood. The increased blood glucose concentration is detected by the pancreas. The pancreas releases insulin, a hormone, into the bloodstream.
Insulin travels in the blood and changes the activity of target tissues in two important ways:
- body cells, especially muscle cells, take up more glucose from the blood and can use it in respiration;
- liver and muscle cells convert glucose into glycogen, the storage form of glucose.
Both responses remove glucose from the blood, so blood glucose concentration falls towards its normal range. As the concentration returns, the stimulus for insulin release becomes smaller and less insulin is released. This is negative feedback: the response opposes the rise that triggered it.
Insulin is a signal, not an enzyme that personally "uses up" glucose. It causes cells and tissues to change what they do.
[DIAGRAM: asset_name: Biology 7.9, 7.13-7.17 - Homeostasis, blood glucose and diabetes - diagram 01; asset_slug: biology_7_9_7_13_7_17_homeostasis_blood_glucose_and_diabetes__diagram_01; recommended_method: image_gen; description: Foundation-accessible monochrome negative-feedback sequence for insulin only: rising blood glucose after a meal points to pancreas releases insulin; insulin points to two effects, body cells take up more glucose and liver and muscle store glucose as glycogen; both point to blood glucose returns towards normal; a final small feedback note says less insulin released. All arrows have clear heads and represent causal sequence; exclude glucagon, diabetes treatment, numerical glucose values and separate-science detail.]
Glucagon raises blood glucose
Higher tier only
When blood glucose concentration falls below its normal range, the pancreas releases the hormone glucagon. Glucagon travels in the blood to the liver and causes liver cells to convert stored glycogen into glucose. The liver releases this glucose into the blood, so blood glucose concentration rises towards the normal range. As the concentration returns, glucagon release reduces.
The direction is crucial:
low blood glucose → glucagon released → liver glycogen converted to glucose → glucose released into blood → blood glucose rises towards normal
Glucagon is the hormone signal; glycogen is the stored carbohydrate. Saying that "glucagon turns into glucose" confuses substances and gives the wrong mechanism.
Type 1 and type 2 diabetes
Diabetes is a condition in which blood glucose control does not work effectively, leading to blood glucose concentrations that are too high. The two main types reach that outcome through different mechanisms, so their controls are not identical.
In type 1 diabetes, the immune system attacks and destroys the insulin-producing cells of the pancreas. The pancreas then produces little or no insulin. Without enough insulin signalling, body cells take up less glucose and less glucose is stored as glycogen, so glucose remains in the blood. Type 1 diabetes is not caused by eating sugar or by a person's lifestyle.
Type 1 diabetes is controlled by replacing the missing insulin, using insulin injections or an insulin pump. The person monitors blood glucose and adjusts insulin with support from their diabetes team, taking account of food and activity. Insulin controls the condition; it does not repair the destroyed cells or cure it.
In type 2 diabetes, body cells respond less strongly to insulin: this is insulin resistance. The pancreas may also fail to make enough insulin to overcome that reduced response. Consequently, glucose uptake and storage are insufficient and blood glucose remains too high.
Type 2 diabetes can be controlled through a suitable diet, physical activity and weight loss when this is appropriate, because these can lower blood glucose and improve the body's response to insulin. Medicines may also be needed, and some people use insulin. Control is individual: no single treatment is right for everyone.
| Feature | Type 1 diabetes | Type 2 diabetes |
|---|---|---|
| Main mechanism | Autoimmune destruction of insulin-producing pancreatic cells; little or no insulin | Cells respond less to insulin and/or the pancreas does not make enough insulin |
| Consequence | Reduced glucose uptake and storage, so blood glucose rises | Reduced glucose uptake and storage, so blood glucose rises |
| Main controls at this level | Insulin replacement plus blood glucose monitoring | Diet, physical activity, weight management where appropriate, medicines and sometimes insulin |
Higher body fat and low physical activity are risk factors for type 2 diabetes, but they are not guarantees. People of different body sizes can develop the condition, and age, inherited factors and ethnicity can also affect risk. A risk factor changes probability; it does not prove a single cause in one individual.
Body measurements and type 2 diabetes
A correlation is an association between two measured variables. Consider this illustrative survey of equally sized adult groups:
| Mean body mass (kg) | People with type 2 diabetes per 1000 |
|---|---|
| 58 | 24 |
| 68 | 35 |
| 78 | 54 |
| 88 | 79 |
The observation is a positive correlation: as mean body mass increases from 58 kg to 88 kg, the number with type 2 diabetes increases from 24 to 79 per 1000. The data support the conclusion that higher body mass is associated with higher type 2 diabetes risk in this survey.
They do not prove that greater body mass caused every case. Body mass does not account for height or show how much mass is fat, and the groups may also differ in age, activity, diet, inherited factors or ethnicity. An observational correlation cannot by itself separate all these variables. A sound evaluation therefore states the pattern with data, identifies a limitation or possible confounding variable, and gives a bounded conclusion about risk, not certainty.
Waist:hip ratio
Waist:hip ratio compares waist circumference with hip circumference. It gives information about fat distribution that body mass alone cannot provide.
Waist:hip ratio
Use the same unit for both measurements. The units then cancel, so the ratio has no unit.
Worked example. A person's waist circumference is 84.0 cm and hip circumference is 105.0 cm.
- Both measurements are already in centimetres, so no conversion is needed.
- Substitute: .
- Calculate: , or 0.80 to two decimal places.
- Sense-check: the waist value is smaller than the hip value, so a ratio below 1 is plausible. The answer has no unit because centimetres cancel.
Body mass index
Body mass index (BMI) relates mass to height. It is a screening measure for adults, not a diagnosis and not a direct measurement of body fat.
Body mass index
Height must be in metres and must be squared before mass is divided by it. BMI has the unit .
Worked example. A person has a mass of 81.0 kg and a height of 180 cm. Calculate BMI to three significant figures.
- Convert height: .
- Square height: .
- No rearrangement is needed because BMI is already the subject of the equation.
- Substitute: .
- Calculate and present: to three significant figures.
- Sense-check: the denominator is a little over 3, so should be about 25; the answer is plausible.
Higher BMI values are correlated with greater type 2 diabetes risk in populations, but BMI cannot distinguish fat from muscle and its interpretation can vary among groups. Waist:hip ratio adds evidence about where body mass is carried, yet neither value can tell whether one person has or will develop diabetes. Diagnosis requires clinical evidence such as blood tests, outside the scope of these calculations.
Homeostasis keeps internal conditions within a controlled range rather than at one exact value. Insulin lowers raised blood glucose; failure of insulin production or response produces different types of diabetes. BMI and waist:hip ratio can contribute evidence about type 2 diabetes risk, but good evaluation keeps correlation separate from causation or diagnosis.
Making a population comparison fair
A scatter diagram can show body mass on the horizontal axis and cases per 1000 on the vertical axis. Compare rates or proportions when group sizes differ: 20 cases among 500 people is per 1000, not 20 per 1000. A frequency table counts people in categories or intervals; a bar chart compares categories, while a histogram groups a continuous quantity such as BMI into intervals. With unequal histogram intervals, compare frequency density rather than bar height alone.
To plot the survey above, choose linear scales that include body masses 58 to 88 kg and 0 to 80 cases per 1000. Label both axes, then plot the four pairs , , and . Draw a suitable line or curve of best fit rather than forcing it through every point. Its upward trend shows the positive association; an estimate between observed values is more defensible than extrapolating beyond the sample.
As a separate illustrative frequency example, eight adult BMI measurements are 20, 22, 23, 24, 26, 27, 28 and 31. Tally each person once in the appropriate interval:
| BMI interval () | Frequency |
|---|---|
| 20 to less than 25 | 4 |
| 25 to less than 30 | 3 |
| 30 to less than 35 | 1 |
A histogram has the BMI intervals on the horizontal axis and, for these equal-width intervals, frequency on the vertical axis; its bars touch. Four of the eight people lie in the first interval, so that interval contains 50% of this small sample. A bar chart for separate categories such as treatment groups has gaps between bars. Neither chart alone establishes a cause of diabetes.
A percentile describes position in an ordered set of measurements. A value at the 75th percentile has about 75% of measurements at or below it; it does not mean a 75% chance of diabetes. Percentiles compare distributions, while a blood test and clinical assessment establish a diagnosis.