Biology 3.19 - 3.20, 3.22 - 3.23 - Variation and mutation
Most features reflect several genes, often together with the environment. Distinguish these causes of variation, investigate an environmental effect, and explain how mutations generate new alleles with different sizes of phenotypic effect.
Phenotype and polygenic features
A phenotype is an organism's observable features. It includes visible features, such as height, and measurable features, such as blood pressure. Phenotype belongs at the scale of the whole organism, but its causes can begin at the scale of DNA and cells.
Polygenic feature
A polygenic feature is influenced by more than one gene. Most phenotypic features are the result of multiple genes rather than single-gene inheritance.
Different alleles of several genes can each make a contribution to one feature. Those genes influence biological processes in cells, and their combined effects contribute to the final phenotype:
Alleles of many genes influence processes in cells and tissues; those effects combine to produce the phenotypic feature.
Height is a useful example. Many genes influence processes involved in growth, so there is no single "height gene" that fixes one exact outcome. Nutrition and health during growth can also influence the observed height, which means that a polygenic feature may be affected by the environment as well.
The word most matters. A few characteristics can be strongly influenced by one gene, but single-gene inheritance is not the best model for most of the differences we observe. Likewise, "polygenic" describes the genetic contribution; it does not mean that environmental effects are absent.
Genetic and environmental variation
Variation means differences in characteristics between organisms of the same species. To explain a difference, first ask whether the cause changes the organism's inherited genetic information, changes the combination of alleles it receives, or acts through its surroundings.
Genetic variation
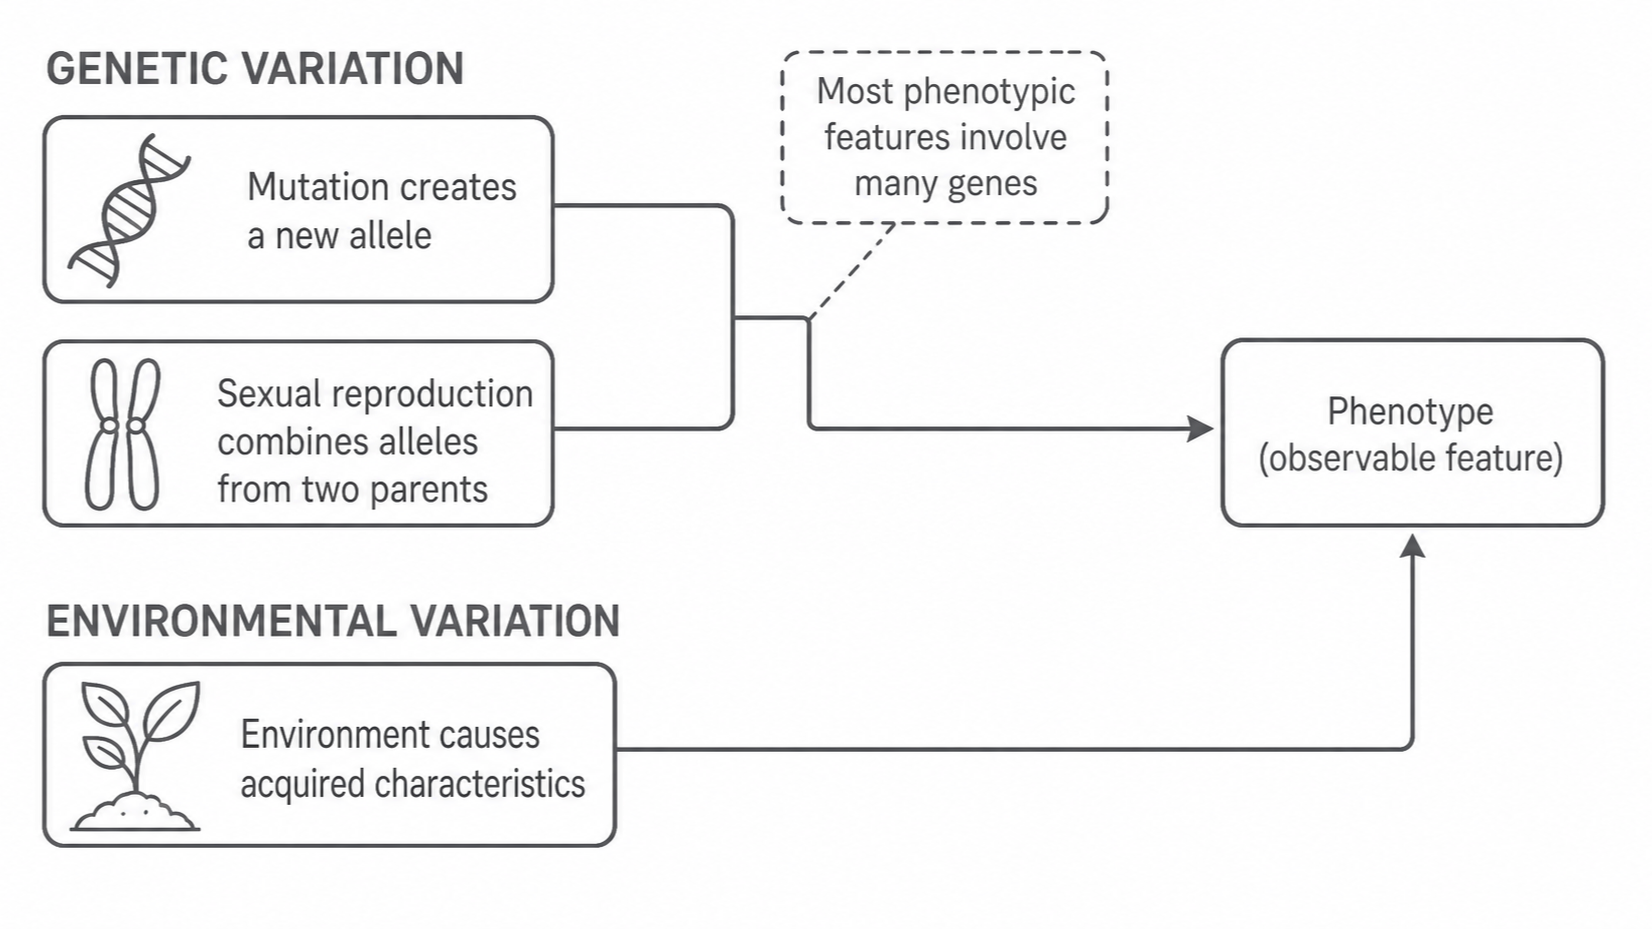
Genetic variation is caused by differences in DNA or alleles. Two processes are central:
- A mutation changes a DNA sequence. It can create a new DNA variant and therefore a new allele.
- Sexual reproduction combines alleles from two parents. Each offspring can receive a different combination, so siblings usually receive different combinations of alleles.
Mutation and sexual reproduction do different jobs. Mutation is the original source of new alleles; sexual reproduction rearranges existing alleles into new combinations. In sexual reproduction, a new mutation can be passed to offspring if it is present in a gamete that contributes to fertilisation. In organisms that reproduce asexually, a DNA change can be passed on when the cell divides.
Environmental variation
Environmental variation is caused by conditions experienced by the organism. The resulting differences are called acquired characteristics. Light intensity can affect the growth of a plant; nutrition can affect human growth; exercise can affect muscle size; and an injury can leave a scar.
An acquired characteristic is not automatically inherited. Exercise changes muscle cells and muscle size, but it does not deliberately rewrite gamete DNA so that an offspring inherits larger muscles. This distinction prevents an environmental effect from being mistaken for genetic variation.
Many phenotypes have both causes. For example, many genes contribute to height, while nutrition and illness during development can alter the height that is reached. The genetic and environmental contributions interact in the organism, but they remain different kinds of cause.
[DIAGRAM: asset_name: Biology 3.19-3.23 - Variation, mutation and genome applications - diagram 01; asset_slug: biology_3_19_3_23_variation_mutation_and_genome_applications__diagram_01; recommended_method: image_gen; description: Landscape monochrome causal map on white: a genetic-variation route containing the exact labels 'Mutation creates a new allele' and 'Sexual reproduction combines alleles from two parents', plus a separate environmental-variation route labelled 'Environment causes acquired characteristics'; arrows from both routes converge on 'Phenotype (observable feature)', beside the statement 'Most phenotypic features involve many genes'. Arrowheads must point from causes towards phenotype; do not imply that acquired characteristics alter or enter DNA.]
Testing an environmental cause
To investigate the effect of light on a plant feature, use cuttings cloned from one parent plant. They have the same inherited genetic information, so inherited differences are controlled. Match a measurable starting feature, such as leaf area or cutting length, and keep soil, water supply, temperature and growing time the same. Vary only the light treatment.
Use several separate cuttings for each treatment. Natural differences between individual plants can then be seen, and a mean leaf area can be calculated for each group. Measuring the same leaf several times can reduce measurement error, but it does not replace growing several plants: the experiment needs biological repeats. A consistent difference between groups is stronger evidence than one unusually large or small plant. A controlled comparison supports a light effect under those conditions; it does not show that genes never affect growth.
Worked data: means and a graph
Here are illustrative final leaf areas from three separate cloned plants at each light intensity. Each treatment lasted six weeks with the other conditions controlled.
| Light intensity (lux) | Plant 1 leaf area () | Plant 2 leaf area () | Plant 3 leaf area () | Mean leaf area () |
|---|---|---|---|---|
| 1000 | 8.1 | 9.3 | 9.6 | 9.0 |
| 2000 | 12.1 | 13.6 | 13.3 | 13.0 |
| 3000 | 14.7 | 15.0 | 15.3 | 15.0 |
The arithmetic mean is the total of the measurements divided by how many measurements there are. For the middle treatment:
An estimate is useful for checking whether a calculated result is sensible. Rounding those measurements to whole numbers gives , so a calculator answer of would be implausible. Use the original measurements for the reported mean; the rounded estimate is a quick check, not a reason to replace available precise data. A graph can also support approximate readings between labelled values, but those must be described as estimates.
To turn the table into a graph, put the changed variable, light intensity, on the horizontal axis and mean leaf area on the vertical axis. Label both axes with units, use evenly spaced numerical scales, and choose ranges that include every value. Here, horizontal steps of 500 lux and vertical steps of work. Plot the three coordinate pairs , and . The straight segments below are guides between measured treatment means, not evidence that every intermediate value was measured.
[DIAGRAM: asset_name: Mean leaf area against light intensity; asset_slug: bio_c_variation_mean_plot_v1; recommended_method: deterministic_plot; description: Three mean values 9, 13 and 15 square centimetres plotted at 1000, 2000 and 3000 lux with labelled axes, even scales and straight connecting guides.]
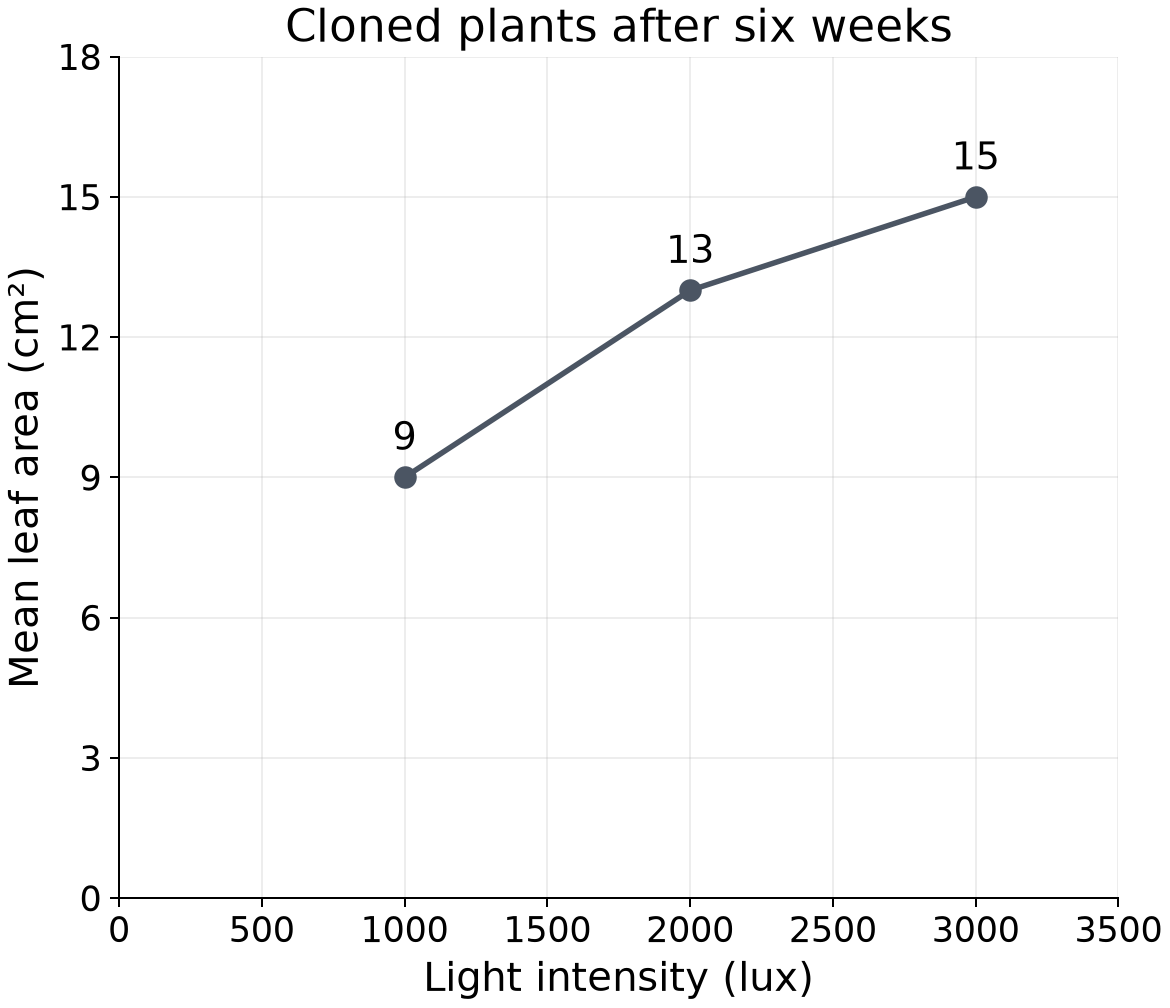
Reading back from the graph gives a mean of at 2000 lux. The rise is between the first two treatments and between the next two: the response increases but is not directly proportional to light intensity. These data support an environmental effect under the tested conditions; they do not predict growth at untested light levels or show that genetic variation never affects leaf area.
Mutation in populations
A population is a group of organisms of the same species living in the same area. Within a population there is usually extensive genetic variation: many DNA sequences and alleles differ among individuals.
Mutations are the source of these new DNA variants. A mutation is not produced because an organism "needs" a feature. Over many generations, mutations that are inherited add new variants to the population, while sexual reproduction repeatedly makes new combinations of the alleles already present.
The amount of genetic variation in a population must not be confused with the effect of one mutation. A population can contain a great many mutations even though most individual mutations do not visibly change the organism.
How much does one mutation affect phenotype?
The specified pattern is uneven:
- Most genetic mutations have no effect on phenotype. The DNA change may not alter the operation of a relevant protein or biological process.
- Some mutations have a small effect on phenotype. They may slightly alter a protein's activity or make a small contribution alongside many other genes.
- Rarely, one mutation significantly affects phenotype. A change in an important gene can have a large consequence for a biological process and therefore for an observable feature.
"No effect", "small effect" and "significant effect" describe the size of the phenotypic consequence. They do not mean "helpful", "slightly harmful" and "very harmful". A large visible effect is not automatically harmful, and the word mutation does not itself tell us whether an outcome is beneficial, harmful or neutral.