4.2.2 - Inequality
Inequality matters because growth can raise national income without raising living standards evenly. For exams, the key is to separate income from wealth, understand how inequality is measured, and explain why development and capitalism can sometimes widen inequality instead of reducing it.
Income and Wealth Inequality
Income is a flow of money received over a period of time, such as wages, salaries, profits, rent, interest, dividends, pensions, or state benefits. Wealth is a stock of assets owned at a point in time, such as property, savings, shares, pension funds, jewellery, or business assets.
That distinction matters because income tells you what someone receives now, while wealth tells you what they already own. A young doctor may have a high annual income but little wealth if they still have debts and no property. A retired homeowner may have a lower monthly income but substantial wealth because they own a house and financial assets.
Income and wealth also reinforce each other. Higher income makes saving easier, so it can build wealth over time. Existing wealth then generates more income through rent, dividends, interest, and capital gains. This is one reason wealth is usually distributed more unequally than income: it accumulates over time and can also be passed on through inheritance. In Great Britain between April 2018 and March 2020, for example, the wealthiest 10% of households held 43% of all household wealth, while the least wealthy half held only 9% (ONS, Wealth and Assets Survey).
Application
In the UK housing market, households who bought property in London or the South East many years ago have often seen large capital gains. A younger household may earn a decent income but still hold far less wealth because it missed those earlier price rises and may still be renting.
Measuring Inequality
Economists often measure inequality by ranking households from poorest to richest and then comparing population shares with income shares.
Definition: Lorenz curve
A curve showing the cumulative percentage of income received by the cumulative percentage of the population, ranked from poorest to richest.
The 45-degree line on a Lorenz diagram is the line of perfect equality. On that line, the poorest 20% receive 20% of income, the poorest 50% receive 50%, and so on. The actual Lorenz curve usually bows below that line because lower-income households receive less than a proportional share of total income.
If, for example, the bottom 50% of households receive only 25% of total income, the top 50% must be receiving the remaining 75%. The further the Lorenz curve lies from the line of equality, the more unequal the distribution.
[DIAGRAM: asset_name: 4.2.2 - Inequality - diagram 1; asset_slug: 4.2.2 - 1; recommended_method: retained_png; description: Retained source diagram supporting 4.2.2 - Inequality; the packaged PNG preserves the original educational visual.]
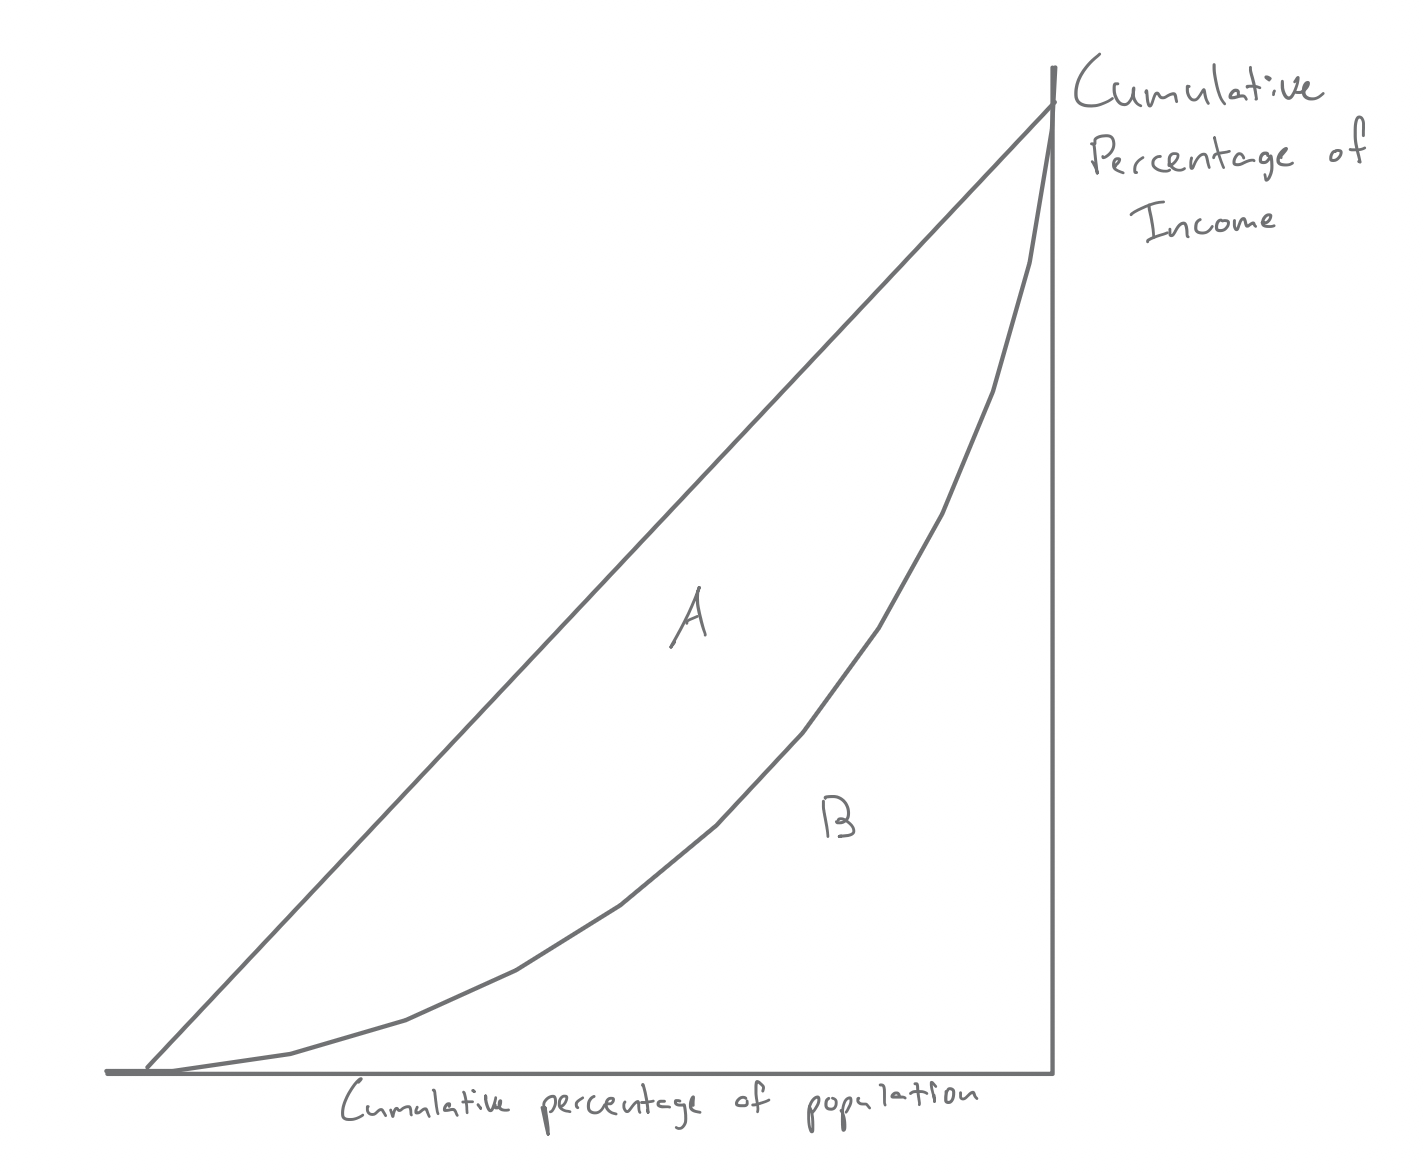
In the diagram, the straight diagonal is the line of perfect equality and the curve that sags below it is the Lorenz curve. Households are ranked from poorest to richest along the horizontal axis, and the cumulative percentage of income is measured up the vertical axis, drawn on the right.
On the Lorenz diagram, area A is the gap between the line of perfect equality and the Lorenz curve, while area B is the area under the Lorenz curve. A larger A relative to A + B therefore means a higher Gini coefficient and greater inequality.
Definition: Gini coefficient
A numerical measure of inequality derived from the Lorenz curve.
A value closer to 0 means greater equality, while a value closer to 1 means greater inequality. It is often reported as a percentage, so a Gini of 0.33 may be written as 33%.
The Gini coefficient is useful because it turns a diagram into one number, so countries or time periods can be compared more easily. But it also has limits. It does not show where in the distribution inequality is concentrated, two countries can have the same Gini with very different income patterns, and published Gini figures are often for income rather than wealth.
Exam tip
Inequality can be measured before and after redistribution. Market-income inequality looks at income before direct taxes and cash benefits. Disposable-income inequality looks at income after those taxes and benefits. This matters because a country can have relatively high pre-tax inequality but noticeably lower post-tax inequality once redistribution is taken into account: the disposable-income Lorenz curve lies closer to the line of equality. In the UK in the financial year ending 2024, the Gini coefficient was 47.6% for original income but 32.9% for disposable income (ONS).
Causes of Inequality
Within a country, inequality comes from differences in both earnings and asset ownership.
Wage differentials are one major cause. Workers with higher skills, stronger qualifications, more experience, or occupations in short supply usually earn more. Hours worked matter too, and discrimination can mean some groups are paid less even for similar work.
Employment status also matters. People in full-time work usually have higher incomes than the unemployed or economically inactive. Retirees may depend on pensions, and households relying mainly on benefits often have lower incomes than working households.
Wealth and inheritance deepen the gap further. People who already own assets can earn rent, interest, and dividends, and they can often take investment risks that poorer households cannot. Inherited wealth gives some households a starting advantage before they earn anything themselves.
Chance and timing matter as well. Buying into a rising property market, entering a booming industry, or receiving a large inheritance can widen inequality even when individual effort is similar. Age matters too: younger people tend to have lower earnings and less accumulated wealth, middle-aged workers often reach peak earnings, and older households have had longer to build assets, although some may run down savings in retirement.
Continue this lesson.
You’re previewing NovaLearn without an account. Create a free account to read the rest.
Create free account