2.3.3 - Long-run AS
Long-run aggregate supply focuses on the economy's productive potential rather than just its current level of output. It helps us judge whether extra aggregate demand will create real growth, or whether the economy is already so close to capacity that higher demand mainly causes inflation instead.
What LRAS Shows
LRAS shows the level of real output an economy can sustain once wages and other costs have had time to adjust. It is therefore closely linked to the quantity and quality of land, labour, capital and enterprise, and to how efficiently those factors are combined.
Definition: Long-run aggregate supply (LRAS)
The total output firms are willing and able to supply when all prices, including wages, are flexible.
This is why LRAS is often described as the economy's productive capacity or potential output. In diagrams, the full-capacity level of output is usually labelled Yf. A rightward shift in LRAS means the economy can produce more sustainably than before. A leftward shift means sustainable capacity has fallen.
LRAS also links neatly to other macro ideas. At full capacity, the economy is operating on its production possibility frontier rather than inside it. LRAS also helps to show the economy's trend rate of growth: it marks the level of output the economy can keep producing in the long run rather than just during a short-lived boom, so the rate at which LRAS shifts to the right over time reflects the trend rate of growth.
Common mistake
An economy can be in macroeconomic equilibrium below Yf. The point where AD and SRAS cross is not automatically full-capacity output.
The Classical View
Classical economists assume that markets are self-correcting. If unemployment appears, wages are expected to fall until firms find it profitable to hire more workers. Because wages and prices are assumed to be flexible, the economy is pulled back toward full employment in the long run.
[DIAGRAM: asset_name: 2.3.3 - Long-run AS - diagram 1; asset_slug: 2.3.3 - 1; recommended_method: retained_png; description: Retained source diagram supporting 2.3.3 - Long-run AS; the packaged PNG preserves the original educational visual.]
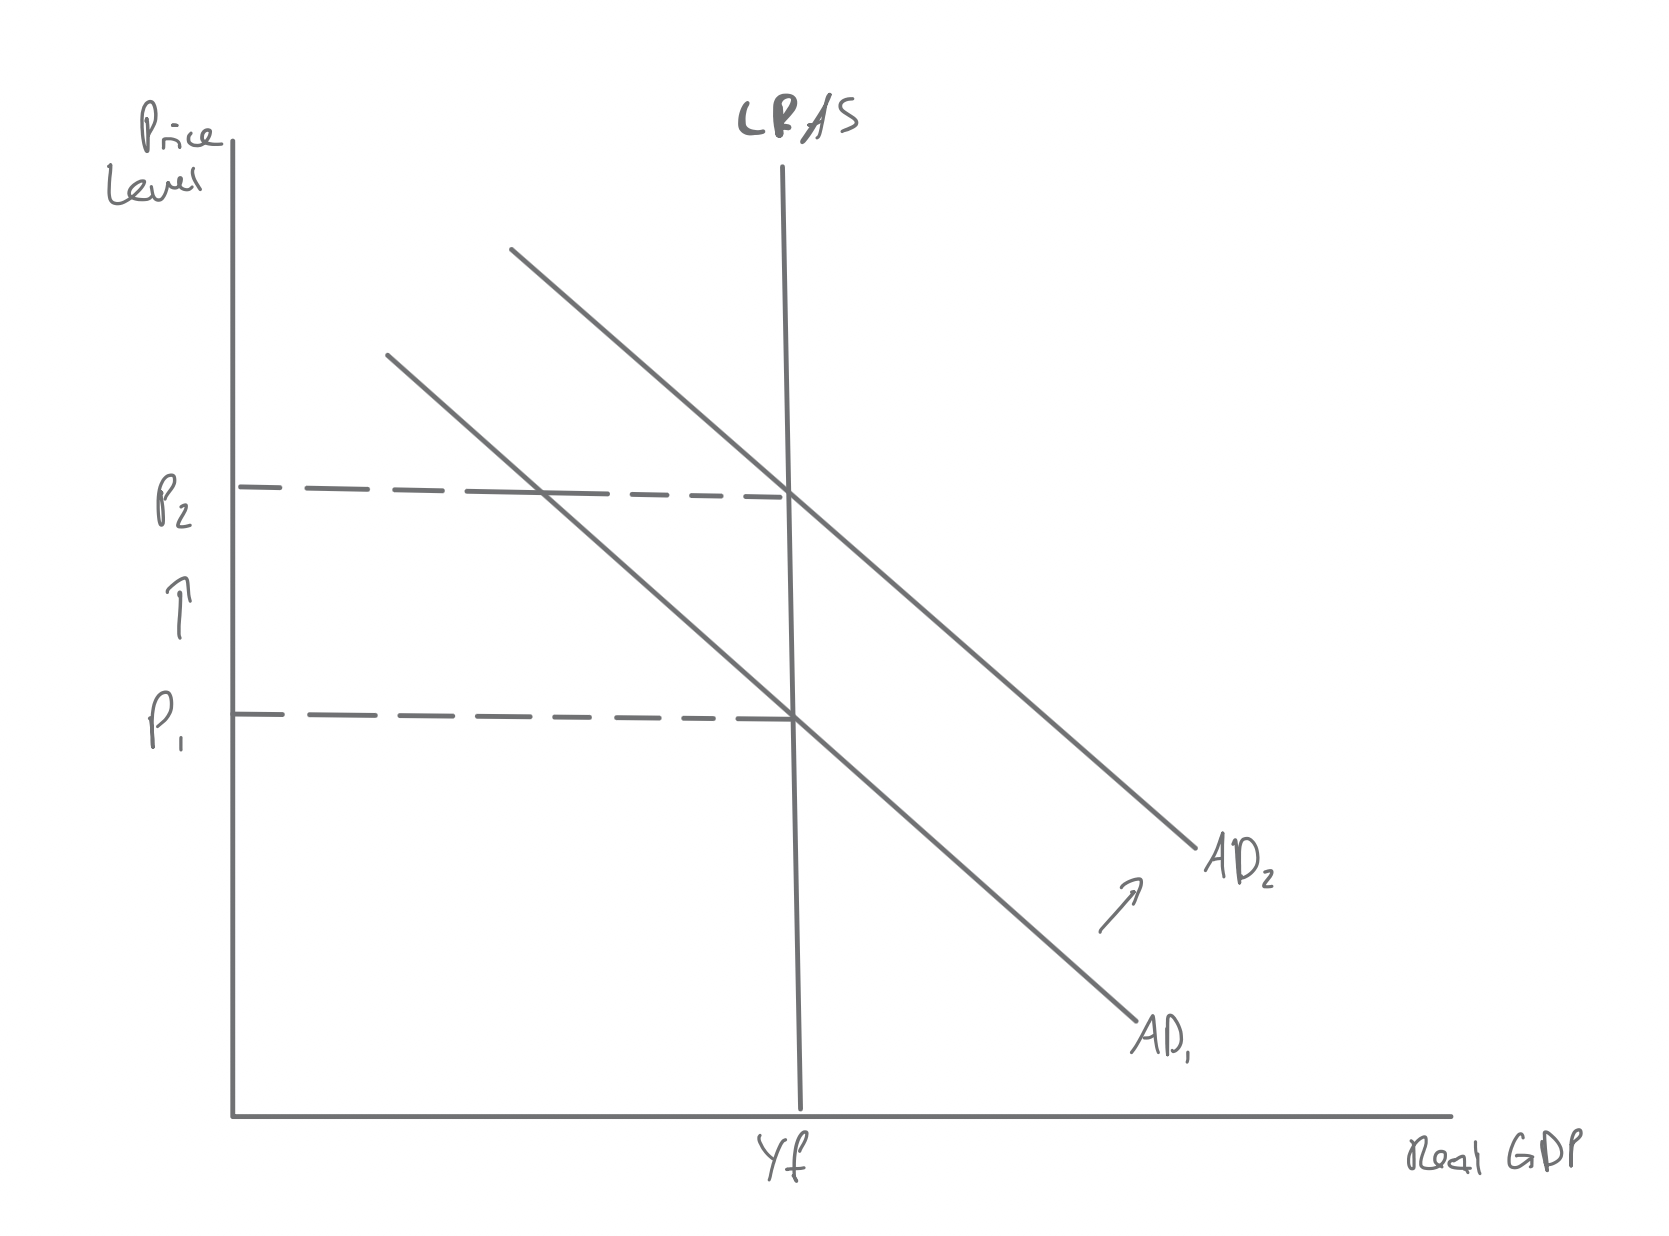
That assumption produces a vertical LRAS curve at Yf. The curve is vertical because, in the Classical view, long-run output is determined by productive capacity, not by the level of aggregate demand. So AD1 and AD2 both cut LRAS at the same Yf, with the price level rising from P1 to P2 instead of real output increasing.
The logic is important. Suppose aggregate demand rises from AD1 to AD2. Firms may initially try to expand production, but if the economy is already at full capacity there are no large pools of unemployed labour or unused capital available. Firms then compete for scarce workers and other resources, wages are bid up, costs rise across the economy, and the main long-run effect is a higher price level rather than higher real output.
This is why the Classical model treats demand-side stimulus with caution. If the economy is already near full capacity, stronger demand mainly creates inflation instead of lasting growth.
The Keynesian View
Keynes challenged the Classical idea that the economy always returns quickly to full employment. Writing in the context of the Great Depression, he argued that wages are often sticky downwards, so unemployment can persist for long periods.
Wages may fail to fall enough for several reasons. Minimum wage legislation creates a legal wage floor. Trade unions may resist wage cuts. Employers may avoid cutting pay because they fear lower morale and weaker productivity. Labour market immobility also matters, because unemployment in one region or occupation can exist at the same time as labour shortages elsewhere.
[DIAGRAM: asset_name: 2.3.3 - Long-run AS - diagram 2; asset_slug: 2.3.3 - 2; recommended_method: retained_png; description: Retained source diagram supporting 2.3.3 - Long-run AS; the packaged PNG preserves the original educational visual.]
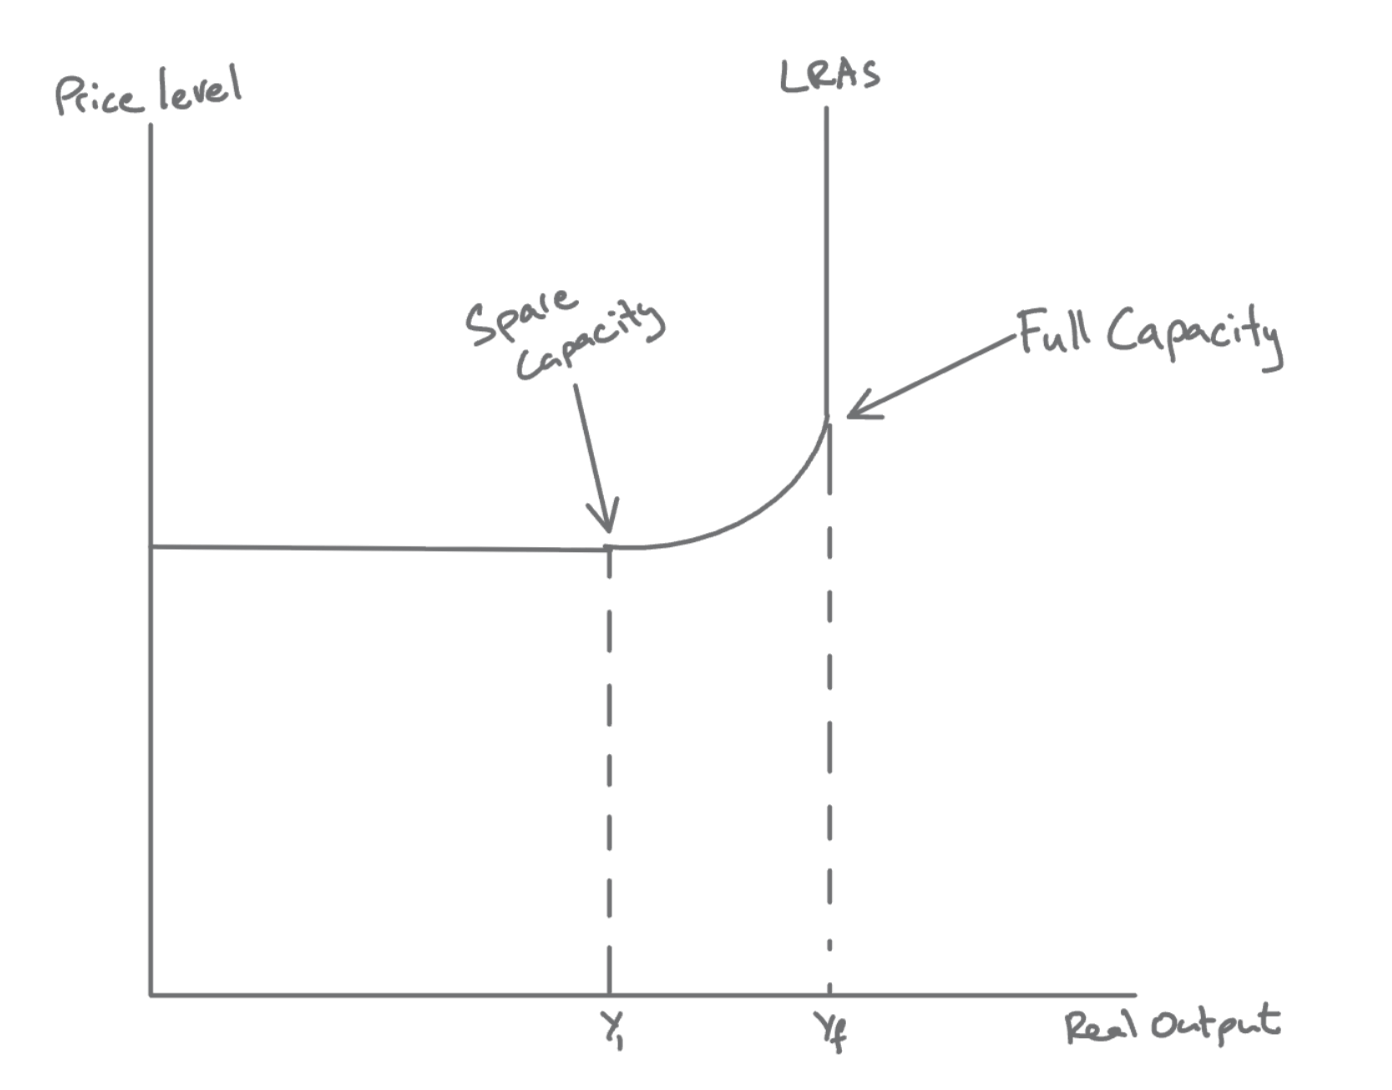
The Keynesian LRAS curve therefore has three sections:
- Below
Y1, the curve is horizontal. The economy has substantial spare capacity, so firms can increase output by hiring unemployed workers and using idle resources without pushing wages and prices up much. - Between
Y1andYf, the curve slopes upward. Spare capacity is running out, so further increases in demand start to create bottlenecks, higher wages and rising costs. Output still rises, but the price level rises too. - At
Yf, the curve becomes vertical. At this point the Keynesian view looks like the Classical view, because the economy has reached full-capacity output.
This gives two useful exam scenarios. If aggregate demand rises while the economy is on the horizontal section, output can increase up towards Y1 while the price level stays the same. But if demand rises again when the economy is already close to Yf, most of the effect is inflation, with little or no further rise in real output.
Exam tip
The Keynesian LRAS curve is not horizontal all the way. It is only flat when there is substantial spare capacity.
Continue this lesson.
You’re previewing NovaLearn without an account. Create a free account to read the rest.
Create free account