2.3.1 - The characteristics of AS
Aggregate demand tells us how much is being spent in the economy. Aggregate supply tells us how much firms are willing and able to produce. To understand macroeconomic equilibrium properly, you need both sides.
What Aggregate Supply Shows
Aggregate supply looks at total output across the whole economy rather than in one market. It shows the relationship between the average price level and real GDP.
Definition: Aggregate supply (AS)
The total quantity of goods and services that firms in an economy are willing and able to supply at different price levels.
In practice, economists usually begin with short run aggregate supply because firms can change output before all wages, contracts, and productive capacity have fully adjusted.
Why SRAS Slopes Upward
The short run is the period in which at least one factor of production is fixed. A firm cannot instantly build a new factory or fully reorganise production, so higher output usually means stretching existing capacity.
Definition: Short run aggregate supply (SRAS)
The total quantity of goods and services firms are willing and able to supply at different price levels when some factors of production are fixed.
[DIAGRAM: asset_name: 2.3.1 - The characteristics of AS - diagram 1; asset_slug: 2.3.1 - 1; recommended_method: retained_png; description: Retained source diagram supporting 2.3.1 - The characteristics of AS; the packaged PNG preserves the original educational visual.]
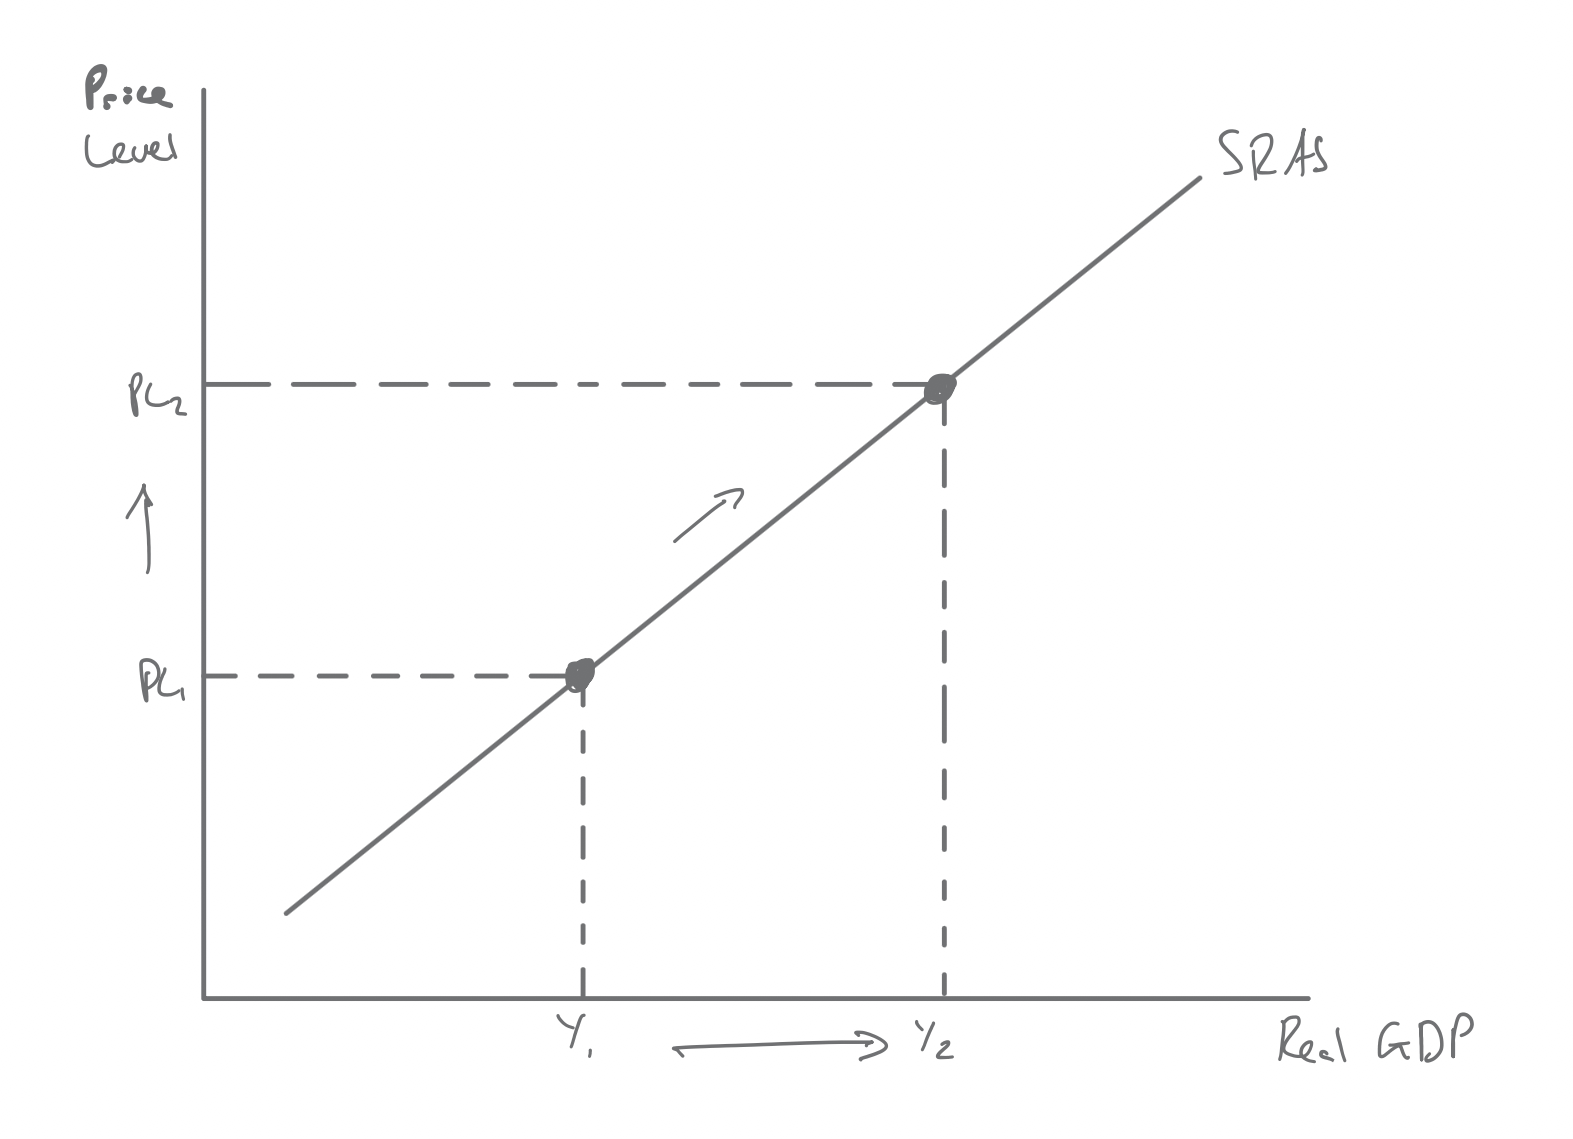
If a business wants to produce more in the short run, it may have to ask existing workers to do overtime, hire temporary staff, run machinery for longer hours, or rely on less efficient backup equipment. Those choices push up marginal cost. So even if firms can expand output, they will usually do so only if the higher price level covers the extra cost.
That is the core reason SRAS slopes upward: a higher price level makes extra production worthwhile, while a lower price level makes some production unprofitable. It also helps that some costs, such as money wages fixed in contracts, do not rise straight away, so a higher price level widens firms' profit margins.
The diagram shows this as a movement along one curve. When the price level rises from PL1 to PL2, the real GDP that firms are willing to supply rises from Y1 to Y2, along the same SRAS curve.
SRAS is also usually drawn as relatively elastic. In the short run, many factor costs are sticky, so a modest rise in the price level can lead to a noticeable rise in output, especially when firms still have some spare capacity. UK parcel and warehouse firms often face this in the run-up to Christmas: they can raise output fairly quickly, but only by paying overtime and bringing in temporary labour.
Movements Along and Shifts
A movement along the SRAS curve happens when the price level changes and all other influences stay the same. A rise in the price level causes an extension of aggregate supply, while a fall in the price level causes a contraction of aggregate supply.
A shift of the SRAS curve happens when conditions of production change. At every possible price level, firms are now willing to supply more or less output than before. The main cause is a change in production costs.
Continue this lesson.
You’re previewing NovaLearn without an account. Create a free account to read the rest.
Create free account