1.4.2 - Government failure
Government intervention is often used to correct market failure, but intervention is not automatically efficient. A policy can be well-intentioned and still make resource allocation worse if it creates new distortions, high running costs, or weak incentives. That is the central idea behind government failure.
Meaning of Government Failure
Economists judge intervention by outcomes, not intentions. If a market failure creates a welfare loss, the government may try to reduce it with taxes, subsidies, regulation, or direct provision. But if the policy creates costs that are even larger than the original problem, society is worse off overall.
Definition: Government failure
Government failure is when government intervention causes a misallocation of resources and creates a net welfare loss.
That is why government failure does not mean "the government meant badly". It means the final allocation is less efficient than before once the full costs of intervention are taken into account.
Formula: Welfare test
A policy improves welfare only if
If the costs created by intervention are larger than the original gain, the policy has caused government failure.
Distorted Signals and Unintended Effects
One major cause of government failure is that intervention can distort price signals and incentives. In markets, prices help coordinate decisions by telling consumers how scarce something is and telling producers whether extra supply is worthwhile. If policy pushes price away from the market equilibrium, behaviour changes, and the change may create a new inefficiency.
[DIAGRAM: asset_name: 1.4.2 - Government failure - diagram 1; asset_slug: 1.4.2 - 1; recommended_method: retained_png; description: Retained source diagram supporting 1.4.2 - Government failure; the packaged PNG preserves the original educational visual.]
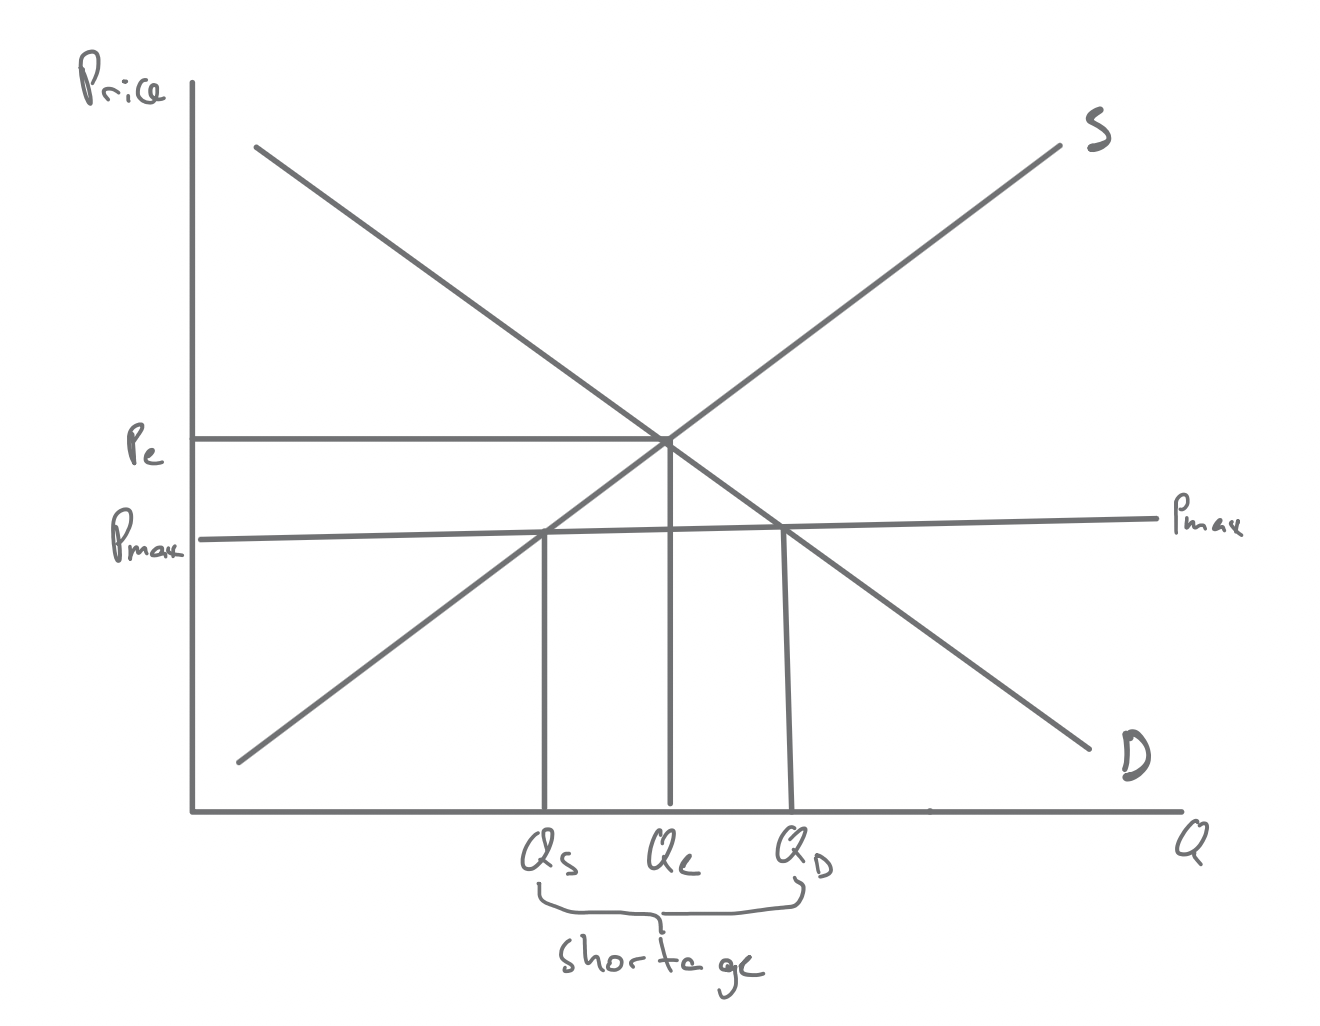
With a rent ceiling at , below the equilibrium rent , tenants want to rent more housing so quantity demanded rises from to , but landlords are willing to supply less so quantity supplied falls to . The gap between and is the shortage. Some landlords may also cut maintenance or leave the market altogether. That means a policy designed to improve affordability can end up reducing the quantity and quality of housing available.
This is where the welfare loss comes from. Only homes are now let, fewer than , so homes that tenants value more than they would cost landlords to supply are no longer provided. Because price can no longer ration the scarce homes, something else does: waiting lists, landlords choosing between applicants, or illegal side payments. If these losses outweigh the gains to the tenants who pay less, the rent cap has caused government failure.
Application
In the Scottish private rented sector, rent caps were introduced to protect tenants during a cost-of-living squeeze. The Cost of Living (Tenant Protection) (Scotland) Act 2022 froze rent increases for existing tenants from 6 September 2022, then capped them at 3% from April 2023, and these emergency measures ended in March 2024. Because the cap applied only within a tenancy, landlords could still reset rents when a new tenant moved in, and advertised rents for new lets rose by 11.4% in the year to the second quarter of 2023 (Citylets). Supporters focused on affordability in the short run, but critics argued that lower returns could discourage landlords from improving properties or staying in the market, which is exactly the sort of trade-off economists consider when judging government failure.
Unintended consequences can appear in other markets too. For example, biofuel subsidies were meant to support cleaner energy use, but they also encouraged some land to switch from food crops to fuel crops, which put upward pressure on food prices. In the United States, about a quarter of the corn crop was being used to make ethanol by 2007-08, and the Congressional Budget Office estimated that this extra demand explained 28-47% of the rise in corn prices between April 2007 and April 2008.
Continue this lesson.
You’re previewing NovaLearn without an account. Create a free account to read the rest.
Create free account