1.2.9 - Indirect taxes and subsidies
Governments do not always leave markets alone. They may want to raise revenue, reduce consumption of harmful goods, support domestic production, or make useful goods more affordable. Indirect taxes and subsidies both work through supply and demand, so the key exam skill is to track what happens to price, quantity, producers' receipts, and the government's own revenue or spending.
Indirect Taxes
An indirect tax is charged on spending rather than directly on income or profits. Firms usually collect the tax and send it to the government, but the burden is shared through the market because prices and producer receipts change after the tax is imposed.
Definition: Indirect tax
A tax on expenditure where the person bearing the burden is not necessarily the person legally responsible for paying it to the government.
There are two forms you need to separate clearly in exams. An ad valorem tax is charged as a percentage of the selling price, such as VAT at 20%. A specific tax is a fixed amount per unit, such as UK fuel duty, a set amount per litre of petrol. Some taxes combine both: UK cigarette duty is a fixed amount per 1,000 cigarettes plus 16.5% of the retail price.
That distinction matters on a diagram. A specific tax creates a constant vertical gap between the original and post-tax supply curves because the tax is the same at every quantity. An ad valorem tax does not create a constant gap because the tax gets larger as the price rises.
A quick way to classify them is to ask: does the tax automatically rise when the product price rises? If yes, it is ad valorem. If no, it is specific.
How a Tax Changes the Market
A specific indirect tax raises firms' costs by a fixed amount per unit. On a standard diagram, the supply curve shifts vertically upward or leftward from S1 to S2 because producers now need a higher market price to cover their costs and the tax.
[DIAGRAM: asset_name: 1.2.9 - Indirect taxes and subsidies - diagram 1; asset_slug: 1.2.9 - 1; recommended_method: retained_png; description: Retained source diagram supporting 1.2.9 - Indirect taxes and subsidies; the packaged PNG preserves the original educational visual.]
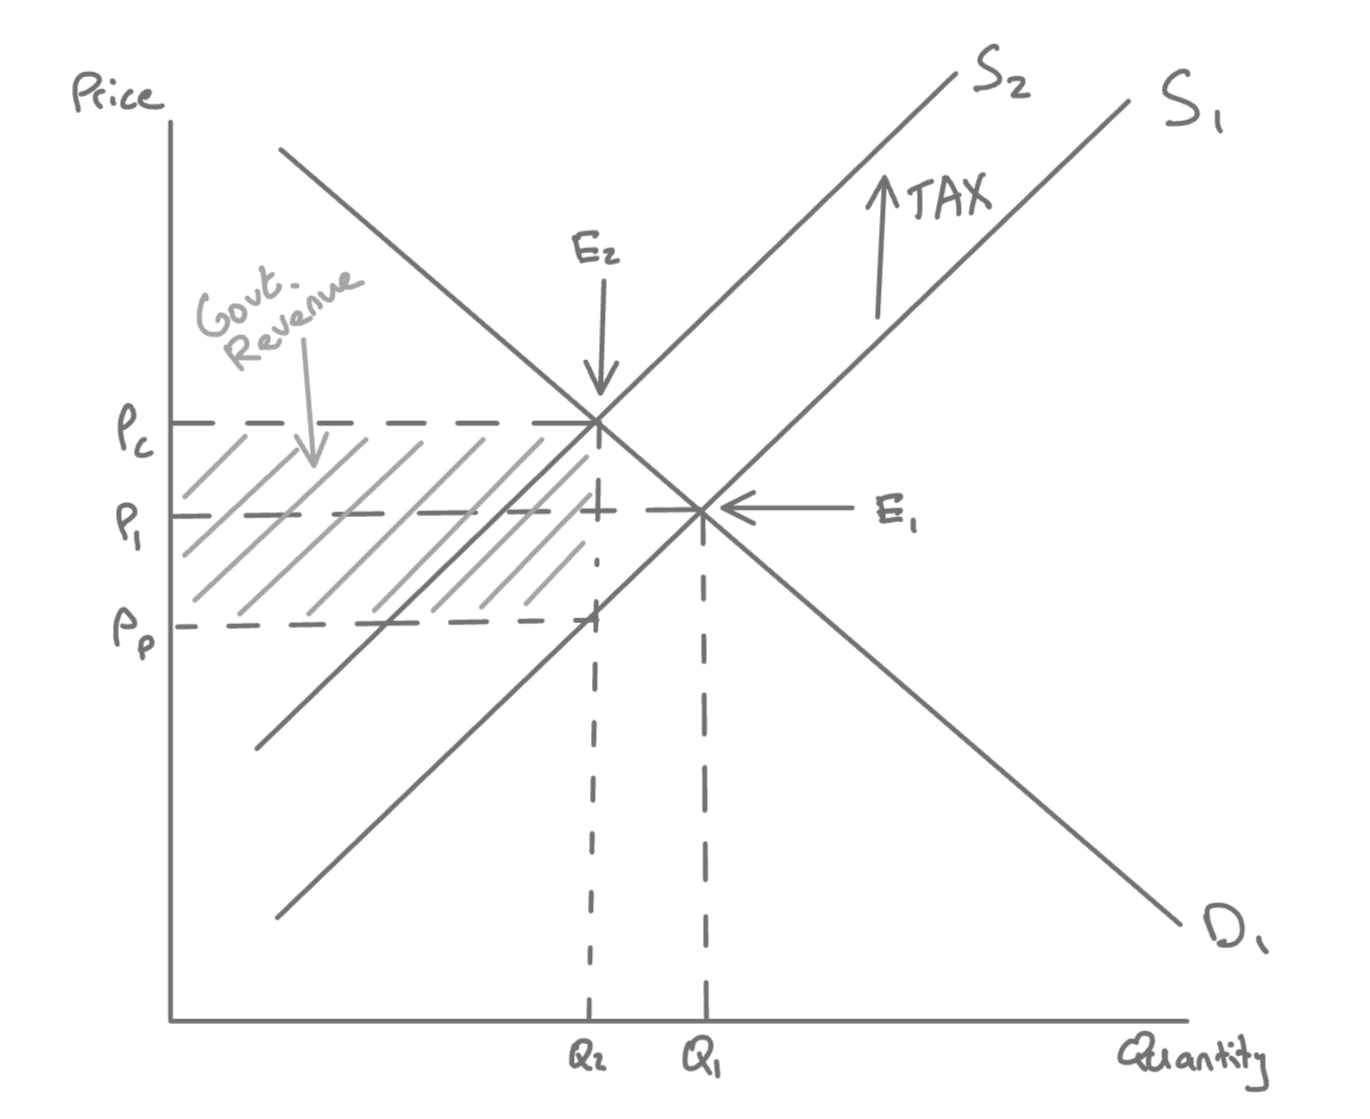
The move from E1 at P1, Q1 to E2 at Pc, Q2 shows the effect clearly. Consumers pay the higher price Pc and buy less, while producers receive only Pp after tax. Producers are therefore hit twice: they receive less per unit and they sell fewer units.
The government gains tax revenue equal to the tax per unit multiplied by the quantity still sold after the tax. On the diagram, this is the rectangle formed by the tax wedge and Q2.
Exam tip
Tax revenue is tax per unit x quantity sold after the tax. Use the post-tax quantity, not the original equilibrium quantity.
An ad valorem tax works in the same direction, but the gap between the original and post-tax supply curves widens as price rises because the tax is percentage-based rather than fixed.
[DIAGRAM: asset_name: 1.2.9 - Indirect taxes and subsidies - diagram 2; asset_slug: 1.2.9 - 2; recommended_method: retained_png; description: Retained source diagram supporting 1.2.9 - Indirect taxes and subsidies; the packaged PNG preserves the original educational visual.]
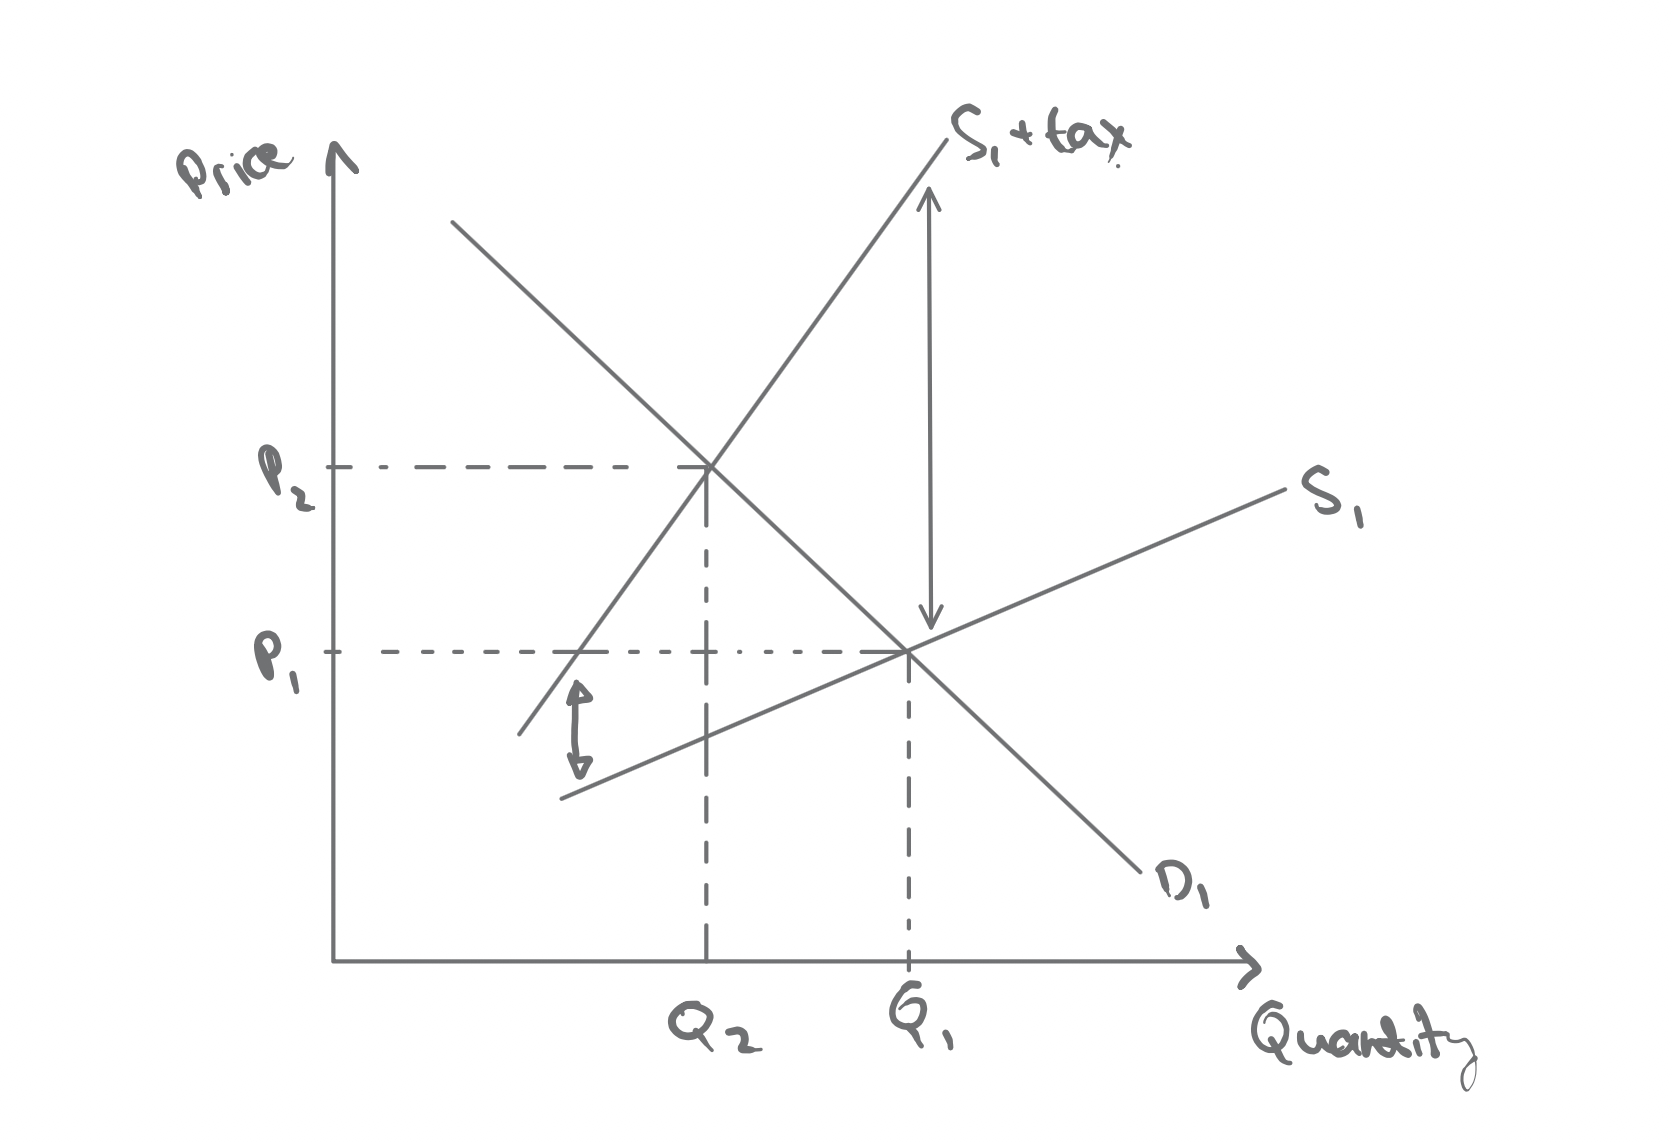
In the diagram, the post-tax supply curve S1 + tax is not parallel to S1: it is steeper because the tax is a percentage of price, so the vertical gap (shown by the two arrows) is small at low prices and large at high prices. Equilibrium moves from P1, Q1 to P2, Q2. Consumers now pay P2, while producers receive only the price on S1 at Q2; the vertical gap between S1 + tax and S1 at Q2 is the ad valorem tax per unit at the post-tax output.
Worked example:
| Price (£) | Quantity demanded | Quantity supplied before tax | Quantity supplied after a £2 tax |
|---|---|---|---|
| 10 | 100 | 1100 | 900 |
| 9 | 200 | 1000 | 800 |
| 8 | 300 | 900 | 700 |
| 7 | 400 | 800 | 600 |
| 6 | 500 | 700 | 500 |
| 5 | 600 | 600 | 400 |
Before the tax, equilibrium is £5 and 600 units because quantity demanded equals quantity supplied. After the £2 tax, equilibrium is £6 and 500 units. Consumers therefore pay £1 more, while producers receive £4 after paying the tax, so they also lose £1 per unit compared with the original £5. In this case the tax burden is shared equally. Tax revenue is £2 x 500 = £1,000: consumers bear £1 x 500 = £500 of it and producers bear the other £500.
Incidence and Elasticity
The incidence of tax is the split of the tax burden between consumers and producers. The side of the market that is less responsive to price changes usually bears the larger share because it has less ability to avoid the tax.
Definition: Incidence of tax
The way the burden of a tax is shared between consumers and producers.
On the specific-tax diagram, the tax revenue rectangle splits at the original price P1. The strip between Pc and P1, up to Q2, is the consumers' share of the tax, because they now pay Pc - P1 more per unit. The strip between P1 and Pp, up to Q2, is the producers' share, because they now keep P1 - Pp less per unit. In the worked example these strips are £500 each.
Exam tip
Do not confuse legal incidence with economic incidence. A government may collect the tax from producers, but the real burden still depends on relative elasticity. The less responsive side of the market bears more of the tax, regardless of who hands the money over to the government.
If demand is relatively inelastic, consumers keep buying even after the price rises. That gives firms more room to pass the tax on, so consumers bear most of the burden. If demand is relatively elastic, buyers cut back sharply or switch away, so producers are forced to absorb more of the tax themselves.
The same logic applies to supply. If supply is relatively inelastic, producers cannot reduce output much, so more of the burden stays with them. In short, the more inelastic side of the market bears more of the tax.
Elasticity also affects government revenue. A tax on a product with inelastic demand causes only a small fall in quantity, so the government still taxes many units and revenue stays relatively high. A tax on a product with elastic demand causes a much larger fall in sales, so revenue is lower, even though the tax may be better at cutting consumption.
Application
UK duties on cigarettes and petrol are often used as examples because demand is relatively inelastic. Consumers still reduce quantity somewhat, but not by much, so a large share of the tax can be passed on in higher prices and the government can raise substantial revenue.
If the government's main aim is to discourage consumption rather than raise revenue, taxing a product with more elastic demand may have a bigger effect on quantity demanded.
Subsidies
A subsidy is a payment from the government to encourage more production or consumption. It works like an indirect tax in reverse, so it is often used to support essential goods, domestic industries, or goods that create wider social benefits.
Definition: Subsidy
A payment from the government that reduces costs and encourages greater production or consumption.
When producers receive a subsidy, their effective cost of supplying each unit falls. On the diagram, supply shifts rightward or downward from S1 to S2. The new equilibrium has a lower price for consumers and a higher quantity traded.
[DIAGRAM: asset_name: 1.2.9 - Indirect taxes and subsidies - diagram 3; asset_slug: 1.2.9 - 3; recommended_method: retained_png; description: Retained source diagram supporting 1.2.9 - Indirect taxes and subsidies; the packaged PNG preserves the original educational visual.]
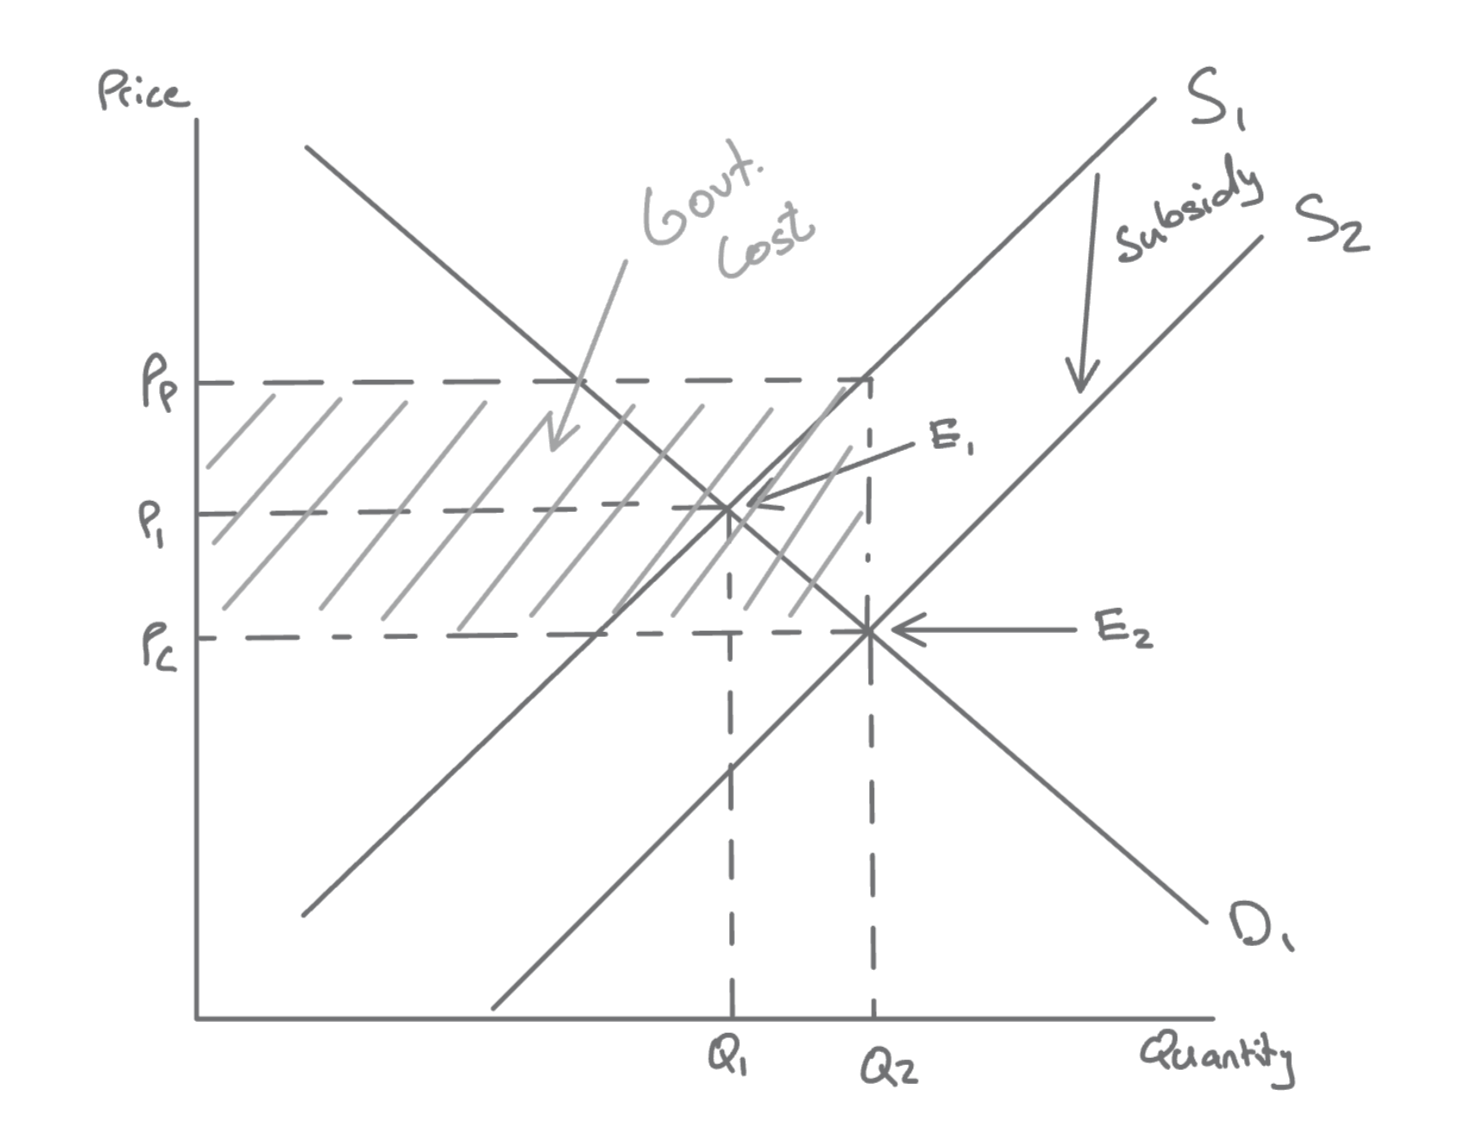
The move from E1 at P1, Q1 to E2 at Pc, Q2 shows that consumers now pay the lower price Pc, while producers receive Pp once the subsidy is added. The vertical gap between S1 and S2 at Q2 is the subsidy per unit, and the rectangle between Pp and Pc from 0 to Q2 is the government's total subsidy cost. Producers benefit because their effective price per unit rises and they sell more output. For the government, the subsidy bill has an opportunity cost: the same money could fund other spending or lower taxes.
Examiners sometimes separate the total gain into consumer subsidy and producer subsidy. Consumer subsidy is the gain from the lower price paid by consumers. Producer subsidy is the gain from the higher effective price received by firms. On the diagram, the government's cost rectangle splits at the original price P1: the consumer subsidy is the area between P1 and Pc up to Q2, that is (P1 - Pc) x Q2, and the producer subsidy is the area between Pp and P1 up to Q2, that is (Pp - P1) x Q2. The split again depends on elasticity.
Worked example: run the earlier table in reverse with a £2 subsidy per unit. Firms now supply at each price what they used to supply at £2 more, so at £4 they offer 700 units, which is exactly what consumers demand. Equilibrium moves from £5 and 600 units to £4 and 700 units. Consumers pay £1 less, and producers receive £4 + £2 = £6, which is £1 more. The government's cost is £2 x 700 = £1,400: a consumer subsidy of £1 x 700 = £700 and a producer subsidy of £700.
If demand is relatively inelastic, consumers tend to capture more of the subsidy through a bigger fall in price. If supply is relatively inelastic, producers tend to capture more through a bigger rise in the price they receive. So, just as with taxes, the less responsive side of the market gets the larger share of the benefit.
UK support for renewable electricity generation is a useful application. A subsidy can encourage firms to supply more low-carbon energy, while lower effective costs can help keep market prices lower than they otherwise would be. The main UK scheme, Contracts for Difference, guarantees low-carbon generators an agreed strike price for each megawatt-hour: when the market price is below it, they are paid the difference, and when the market price is above it, they pay the difference back.
Quick Recap
Indirect taxes shift supply left, raise the price paid by consumers, lower the price received by producers, and reduce quantity traded. Subsidies shift supply right, lower the price paid by consumers, raise the effective price received by producers, and increase quantity traded. In both cases, elasticity matters because the less responsive side of the market gets the larger share of the burden or the benefit.