2.5.3 - Trade (business) cycle
Real GDP does not usually grow at a perfectly steady pace. Instead, actual output moves around the economy's long-run trend growth path, creating recognisable periods of boom, slowdown, recession, and recovery. Understanding the trade cycle helps explain why unemployment, inflation, confidence, investment, imports, and the government's budget position change over time.
Mapping the Cycle
The trade cycle, also called the business cycle or economic cycle, describes repeated fluctuations in economic activity over time.
Definition: Trade (business) cycle
The fluctuations in the level of economic activity over time.
[DIAGRAM: asset_name: 2.5.3 - Trade (business) cycle - diagram 1; asset_slug: 2.5.3 - 1; recommended_method: retained_png; description: Retained source diagram supporting 2.5.3 - Trade (business) cycle; the packaged PNG preserves the original educational visual.]
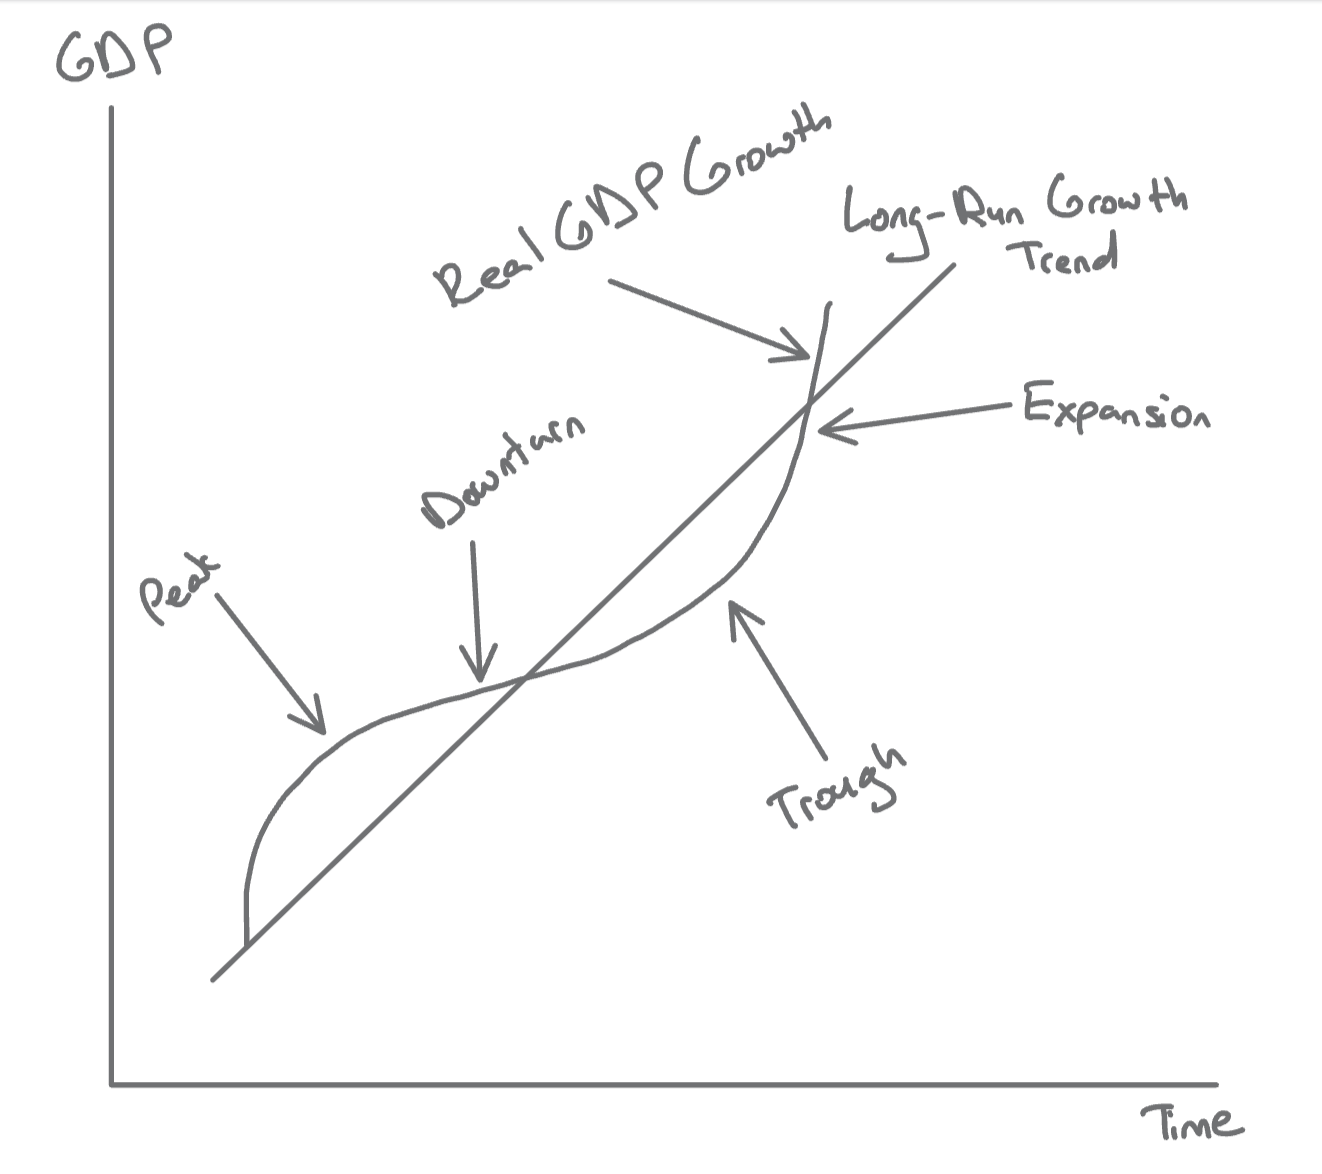
On the diagram, the straight line labelled Long-Run Growth Trend shows the trend level of real GDP, while the wavy line (labelled Real GDP Growth) shows the path of actual real GDP over time. A peak or boom is the highest point of economic activity. A downturn begins when output growth weakens and spending starts to soften. A trough is the lowest point of the cycle, and the economy then moves into recovery or expansion as output begins to rise again.
On this diagram, the peak and the trough are the points where actual GDP is furthest above and furthest below the trend line. The Downturn label sits where actual GDP falls back to the trend line, and Expansion where it climbs back above it.
Different textbooks use slightly different labels. Some simplify the cycle into just expansion and contraction. Others use terms such as recession, slump, or depression for especially weak periods. The main idea is unchanged: actual output does not rise in a smooth straight line.
The cycle can also vary in severity. In a deep trade cycle, real GDP actually falls during the downturn. In a mild trade cycle, output still rises overall, but the growth rate slows sharply, perhaps from 3% to 1%, before accelerating again.
Boom Characteristics
Definition: Boom
A period of strong economic activity with rapid growth in real GDP.
In a boom, real GDP is growing quickly and the economy may operate at, or even beyond, its productive potential. Firms increase output, hire more workers, and become more willing to invest because sales look strong. Unemployment tends to fall towards very low levels, and consumer and business confidence is usually high.
Booms are also often associated with a positive output gap. That means actual GDP is above the economy's sustainable potential level, so firms may rely on overtime, extra shifts, and very intensive use of capital to meet demand. When aggregate demand keeps rising faster than the economy can comfortably supply, demand-pull inflation becomes more likely.
The late-1980s UK boom (often called the Lawson boom) is a useful illustration. Strong demand, fuelled by tax cuts and a surge in borrowing, lifted output by over 4% a year in 1987 and 1988 and pushed unemployment down. But inflation rose towards 10% by 1990, interest rates were raised to 15% in October 1989 to cool demand, and the boom ended in the early-1990s recession.
Boom conditions usually improve the government's budget position as well. As incomes, spending, and profits rise, the government collects more income tax, VAT, and corporation tax. At the same time, spending on unemployment-related benefits tends to fall. The budget position may therefore move towards surplus. Imports often rise too because households buy more foreign goods and firms import more raw materials and components when demand is strong.
Recession Characteristics
Definition: Recession
A period of negative economic growth, often identified as two consecutive quarters of falling real GDP.
A recession is the opposite phase of the cycle. Output falls or remains very weak, and actual GDP usually moves below productive potential. This creates a negative output gap, which means there is spare capacity in the economy: workers are unemployed, machines are underused, and firms can produce more without hitting major capacity limits.
As demand weakens, firms cut production and may lay off workers. This creates demand-deficient unemployment, also called cyclical unemployment. Confidence usually falls as well. Households worried about job security often reduce spending and increase precautionary saving, while firms postpone or cancel investment projects because sales prospects look weak. That reduced consumption and investment can deepen the downturn further.
Inflation usually falls in recession because demand is weak. In a severe downturn, the economy may even experience deflation, where the general price level falls. Government finances also tend to worsen automatically because tax revenues fall while spending on benefits and other support rises. That tends to widen the budget deficit and increase borrowing. Smaller firms are often especially vulnerable because they may not have large cash reserves to survive a long drop in revenue.
A long recession can also damage future growth. If firms cut capital spending for too long and workers remain unemployed for long periods, the economy's productive capacity may grow more slowly in the future.
Continue this lesson.
You’re previewing NovaLearn without an account. Create a free account to read the rest.
Create free account