4.1.2 - Specialisation and trade
Countries do not trade only because one economy cannot make a product. They also trade because scarce resources have different opportunity costs in different countries. That is why trade can still be worthwhile even when one country looks more efficient at producing everything in absolute terms.
Absolute Advantage
Absolute advantage is the easy starting point. If the same amount of resources produces more of a good in one country than another, the more productive country has the absolute advantage in that good.
Definition: Absolute advantage
When a country can produce a good more cheaply in absolute terms, or produce more with the same resources, than another country.
Suppose 100 units of resources can produce the following:
| Country | Umbrellas | Cars |
|---|---|---|
| UK | 70 | 140 |
| Spain | 140 | 80 |
Spain has an absolute advantage in umbrellas because 140 is greater than 70. The UK has an absolute advantage in cars because 140 is greater than 80. In a case like this, specialisation is straightforward: each country can focus more on the good it produces more efficiently, then trade.
This kind of logic helps explain some real trade patterns. Saudi Arabia, for example, has a strong absolute advantage in crude oil production because its geology makes extraction much cheaper than in countries such as the UK. But economists care even more about the harder case where one country seems better at producing both goods.
Comparative Advantage and Opportunity Cost
Comparative advantage asks a different question. Instead of asking who can produce more, it asks who gives up less of the next-best alternative. That is the language of opportunity cost.
Definition: Comparative advantage
When a country can produce a good at a lower opportunity cost than another country.
Now use a tougher example:
| Country | Umbrellas | Cars |
|---|---|---|
| UK | 70 | 80 |
| Spain | 140 | 140 |
Spain has an absolute advantage in both goods, so absolute advantage alone would suggest the UK has little reason to trade. Comparative advantage shows why that conclusion is wrong.
The opportunity cost calculations are:
| Country | Opportunity cost of 1 umbrella | Opportunity cost of 1 car |
|---|---|---|
| Spain | 1 car | 1 umbrella |
| UK | 80/70 = 1.14 cars | 70/80 = 0.875 umbrellas |
Spain gives up only 1 car when it makes 1 umbrella, while the UK gives up about 1.14 cars. Spain therefore has comparative advantage in umbrellas. The UK gives up only 0.875 umbrellas when it makes 1 car, while Spain gives up 1 umbrella. The UK therefore has comparative advantage in cars.
The key idea is relative efficiency. The UK does not need to be best at making cars in absolute terms. It only needs to be less inefficient at cars than it is at umbrellas. With the same resources, the UK makes 80/140 (about 57%) of Spain's car output but only 70/140 (50%) of its umbrella output, so its disadvantage is smaller in cars.
Common mistake
Do not justify comparative advantage with absolute output ("Spain makes more cars, so Spain should make cars"). Compare opportunity costs. In a two-country, two-good model, one country cannot have the comparative advantage in both goods: each opportunity cost is the reciprocal of the other, so a lower cost in one good means a higher cost in the other.
How Trade Creates Gains
Once each country specialises more in the good where it has comparative advantage, trade can raise consumption possibilities. The gain does not come from magic. It comes from shifting resources towards the activity with the lower opportunity cost.
For trade to be mutually beneficial, the exchange ratio between the two goods must lie between the two countries' opportunity costs.
Definition: Terms of trade
The rate at which a country's exports exchange for its imports.
In the example above, the UK's opportunity cost of 1 car is 0.875 umbrellas, while Spain's is 1 umbrella. So a trading rate of 1 car for 0.9 umbrella lies between the two costs. That makes trade worthwhile for both sides. The UK can export a car and receive 0.9 umbrella, which is better than switching its own resources and getting only 0.875 umbrella. Spain can give up 0.9 umbrella to import a car that would cost 1 full umbrella to make at home.
A compact way to see the gain is to compare consumption possibilities. If the UK specialises fully in cars, it can produce 80 cars. If it exports 20 cars for 18 umbrellas, it is left with 60 cars and 18 umbrellas. On its own production possibility frontier (PPF), producing 60 cars would leave room for only 17.5 umbrellas. Trade has let the UK consume a bundle just beyond its own PPF. Spain can make the same kind of gain: if it specialises in umbrellas, exports 18 umbrellas, and imports 20 cars, it keeps 122 umbrellas and 20 cars. On its own PPF, producing 20 cars would leave room for only 120 umbrellas.
[DIAGRAM: asset_name: 4.1.2 - Specialisation and trade - diagram 1; asset_slug: 4.1.2 - 1; recommended_method: retained_png; description: Retained source diagram supporting 4.1.2 - Specialisation and trade; the packaged PNG preserves the original educational visual.]
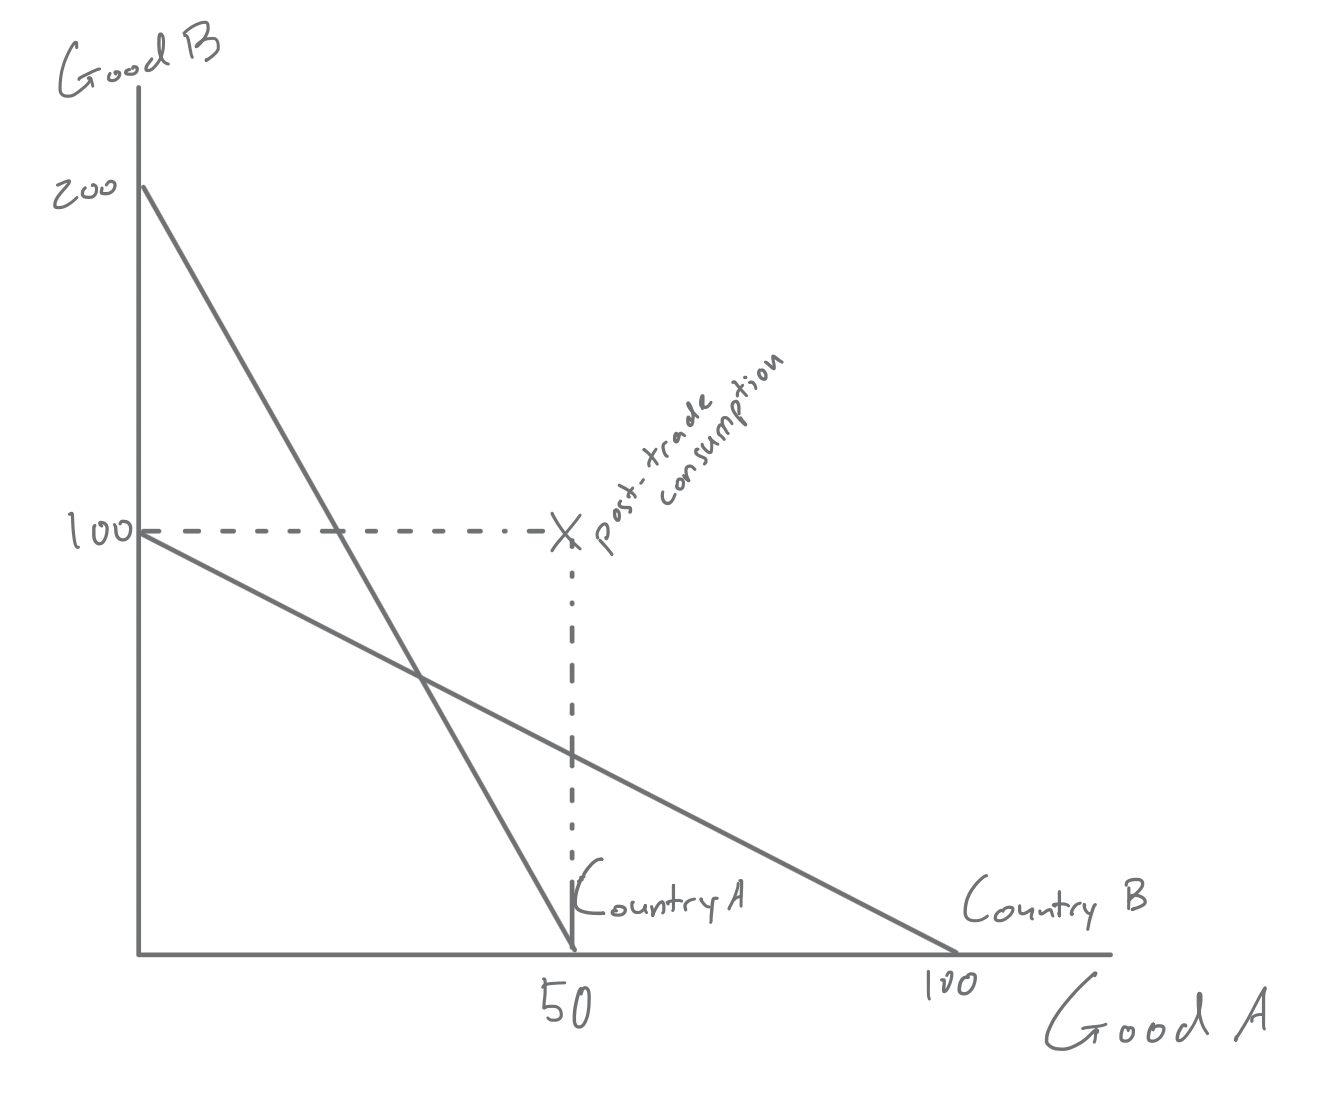
In the diagram, Good A is on the horizontal axis and Good B on the vertical axis. Country A can produce 200 units of Good B or 50 units of Good A, so 1 unit of Good A costs it 4 units of Good B. Country B can produce 100 units of either good, so 1 unit of Good A costs it only 1 unit of Good B. Country B therefore has comparative advantage in Good A, and Country A in Good B. If Country A specialises fully in Good B (200 units), Country B specialises fully in Good A (100 units), and they trade 100 units of Good B for 50 units of Good A, a rate of 2 B per A that lies between the two opportunity costs, each country can consume 50 units of Good A and 100 units of Good B. That is the post-trade consumption point marked X, which lies beyond both countries' PPFs.
The diagram matters because the slope of each PPF shows opportunity cost. The steeper PPF shows the country with the higher opportunity cost of Good A in terms of Good B, while the flatter PPF shows the country with the lower opportunity cost of Good A and so the comparative advantage in that good. The post-trade consumption point beyond each country's own PPF represents the gain from specialisation and exchange. If the two PPFs had the same slope, the countries would face the same trade-off between the two goods. In that case there would be no comparative advantage and no special gain from specialising on that basis.
In textbook models, complete specialisation is common because costs are assumed to be constant. In the real world, partial specialisation is more common because demand patterns, transport costs, adjustment costs, and policy barriers all matter.
Common mistake
Trade gains do not require the physical output of every good to rise at the same time. The key test is whether trade lets countries consume a bundle beyond what they could achieve on their own.
Continue this lesson.
You’re previewing NovaLearn without an account. Create a free account to read the rest.
Create free account