2.6.4 - Conflicts and trade-offs between objectives and policies
Governments usually want several macroeconomic objectives at the same time: low inflation, low unemployment, economic growth, a sustainable external position, environmental protection, a sustainable budget position and greater income equality. The difficulty is that one policy rarely improves all of them together. Good evaluation means spotting the trade-off, then judging which objective matters most in the circumstances.
Conflicts Between Objectives
Some tensions exist even before policy is chosen. Faster economic growth usually means more production, more transport, more energy use, and more demand for raw materials. That can damage the environment in three main ways: production creates pollution and waste, non-renewable resources are used up faster, and expanding economic activity can destroy habitats.
This does not mean growth and environmental protection can never move together. Green growth tries to raise output using cleaner technology and renewable energy, while decoupling means increasing GDP without the same increase in resource use. Even so, stricter environmental protection may still mean slower growth than would otherwise have occurred.
Growth can also conflict with the balance of payments, especially through the current account. When incomes rise, households and firms often buy more imports. If domestic firms cannot expand output quickly enough, imported goods fill the gap, so imports rise faster than exports and the current account deteriorates.
How growth is generated matters. Export-led growth is more likely to support the current account because foreign demand is driving output. Consumption-led growth is more likely to worsen it because part of the rise in spending leaks abroad through imports.
Application
China's long period of rapid growth was often supported by export-led manufacturing, which helped it run trade surpluses for many years. India has more often faced current account pressure when domestic demand and imports rose quickly.
Growth can also conflict with low inflation. If aggregate demand grows faster than the economy's productive capacity, firms run short of spare capacity and workers, so demand-pull inflation builds. Growth is least inflationary when it comes from rising productive capacity rather than from demand running ahead of it. The best-known version of this tension, between unemployment and inflation, is the Phillips curve.
The Short-Run Phillips Curve
The best-known short-run macroeconomic trade-off is between unemployment and inflation. In 1958, A.W. Phillips used UK data from 1861 to 1957 to show an inverse relationship between unemployment and wage inflation. Economists later adapted this idea into the short-run Phillips curve.
Definition: Short run Phillips curve
The inverse relationship between the rate of unemployment and the rate of inflation in the short run.
The logic is straightforward. When unemployment is low, the labour market is tight. Firms struggle to recruit, workers have more bargaining power, and wages tend to rise faster. Higher wage costs then push up firms' costs of production, and some of those higher costs are passed on as higher prices. Inflation therefore tends to rise.
When unemployment is high, there is a surplus of labour. Workers have less bargaining power, wage growth is weaker, firms face less cost pressure, and inflation is usually lower.
[DIAGRAM: asset_name: 2.6.4 - Conflicts and trade-offs between objectives and policies - diagram 1; asset_slug: 2.6.4 - 1; recommended_method: retained_png; description: Retained source diagram supporting 2.6.4 - Conflicts and trade-offs between objectives and policies; the packaged PNG preserves the original educational visual.]
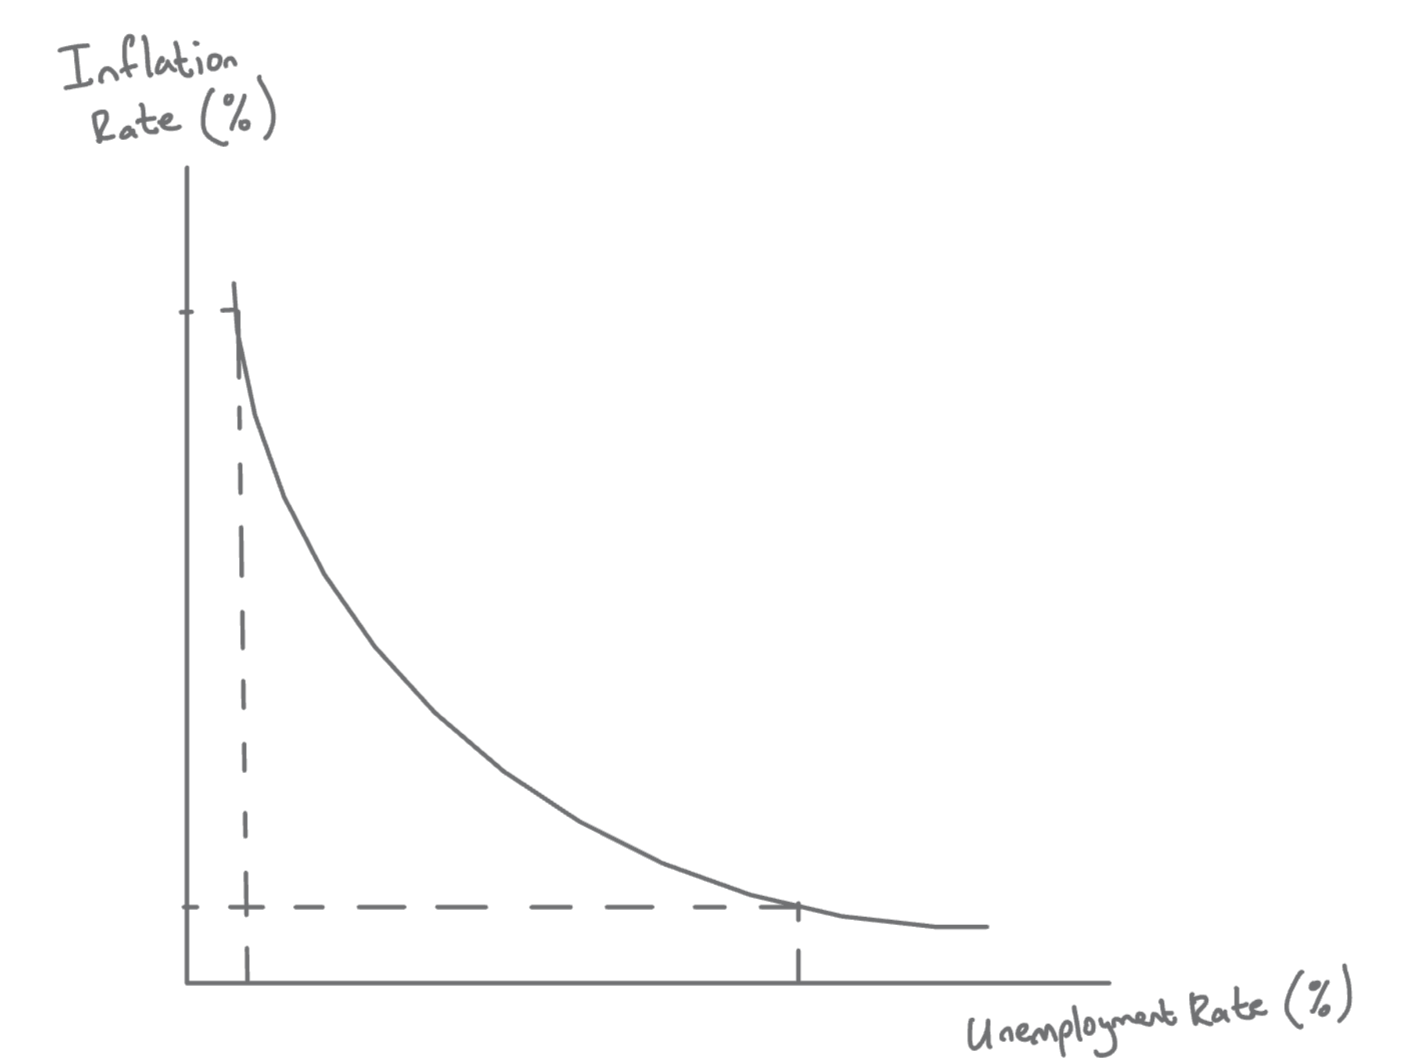
For policymakers, this seemed to offer a menu of choices. They could use stronger aggregate demand to reduce unemployment, but they would usually have to accept higher inflation. If they wanted to squeeze inflation down, they would usually need weaker demand and therefore higher unemployment.
Why the Curve Can Shift
The Phillips curve looked convincing until the 1970s, when many economies experienced stagflation, high inflation and high unemployment at the same time. That appeared to break the simple trade-off.
The key reason was adverse supply-side shocks, especially the oil price shocks of 1973 and 1979. Higher oil prices raised firms' costs of production, so short-run aggregate supply shifted left. Prices rose, but output fell, so unemployment increased as well.
This is why economists distinguish between movements along the curve and shifts of the curve. A demand-side expansion usually moves the economy along a given short-run Phillips curve. A negative supply shock shifts the whole curve outward, so every unemployment rate is now associated with a higher inflation rate than before.
Many economists, especially monetarists, also argue that there is no permanent long-run trade-off. In that view, the long-run Phillips curve is vertical at the natural rate of unemployment. Governments may be able to push unemployment below that rate for a while, but not indefinitely. The reason is expectations: once workers expect higher inflation, they bargain for higher money wages, so the short-run curve shifts upward and unemployment drifts back towards the natural rate, now with higher inflation.
Common mistake
Do not treat the Phillips curve as a fixed rule. The inverse relationship is mainly a short-run idea, and supply shocks can cause inflation and unemployment to rise together.
Continue this lesson.
You’re previewing NovaLearn without an account. Create a free account to read the rest.
Create free account