3.4.5 - Monopoly
Monopoly sits at the opposite end of the spectrum from perfect competition. Instead of many price-taking firms, one dominant seller has market power, which changes how price, output, profit, and efficiency are determined. That makes monopoly central to Edexcel questions on business behaviour, regulation, and the trade-off between static and dynamic efficiency.
Market Power in Monopoly
Definition: Monopoly
A market structure in which one firm dominates the market, commonly taken in exam use as having at least 25% market share.
That exam definition is broader than a pure monopoly, where a single firm is the only seller and there are no close substitutes. In the real economy, pure monopoly is rare, but monopoly power is common whenever one firm has enough market share to influence price and exclude serious competition.
A monopoly lasts only if barriers to entry are strong. These may come from economies of scale, patents, control of essential resources, legal restrictions such as licences or franchises, strong brand loyalty, or network effects. Without barriers, any supernormal profit would attract new firms into the market.
A pure monopolist faces the whole market demand curve, and a dominant firm faces a large share of it, so a monopolist is a price maker, not a price taker. Its demand curve therefore slopes downward. If it wants to sell more, it must accept a lower price, so it can choose price or quantity, but not both independently.
In Edexcel, it is useful to compare monopoly with perfect competition straight away. A perfectly competitive firm takes the market price as given, but a monopolist has discretion over price because consumers have fewer alternatives.
Price, Output and Profit
A monopolist still follows the standard profit-maximising rule:
The difference is that monopoly demand slopes downward, so marginal revenue is below average revenue:
The intuition is simple. To sell one extra unit, the firm must lower price, and that lower price applies to previous units too. That means the extra revenue from the last unit is less than the price charged. For example, if a firm sells 10 units at £10 (revenue £100) but must cut the price to £9.50 to sell 11 (revenue £104.50), the 11th unit adds only £4.50 of revenue, well below its £9.50 price. On a straight-line exam diagram, the MR curve therefore lies below AR and is twice as steep.
[DIAGRAM: asset_name: 3.4.5 - Monopoly - diagram 1; asset_slug: 3.4.5 - 1; recommended_method: retained_png; description: Retained source diagram supporting 3.4.5 - Monopoly; the packaged PNG preserves the original educational visual.]
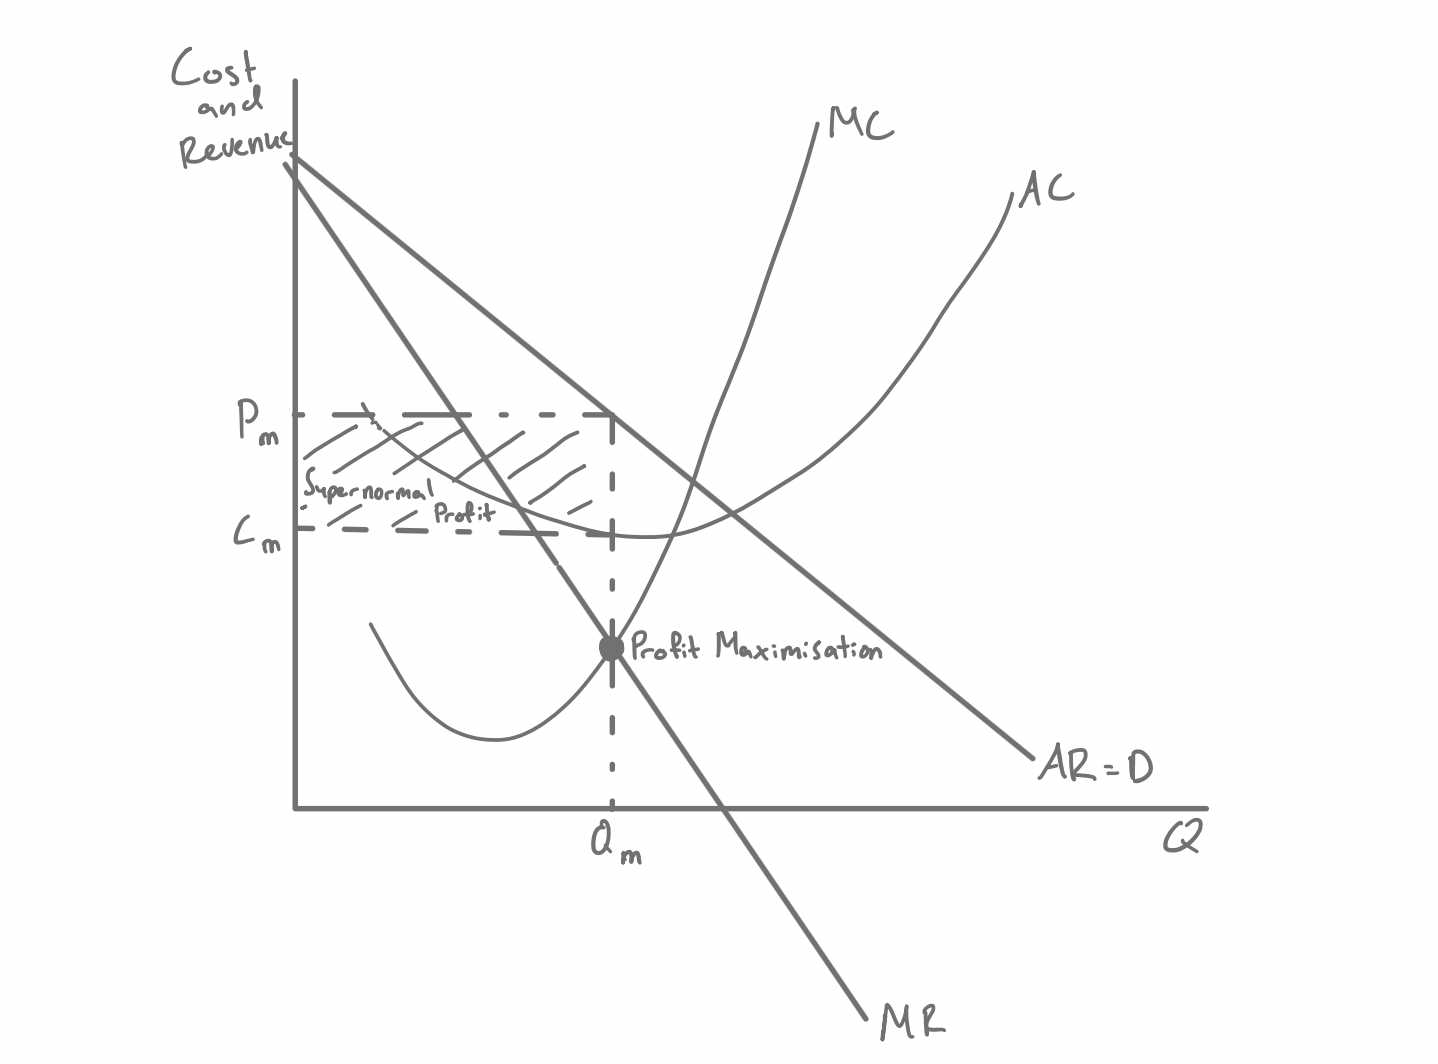
To read the diagram, first find the output Qm where MC = MR. Then move vertically up to the AR curve to find the monopoly price Pm. If Pm is above average cost at Qm (marked Cm), the rectangle between Pm and Cm across to Qm is supernormal profit, calculated as:
Common mistake
Do not read the price from the point where MC = MR. That point only fixes the quantity. The price is read from the AR curve directly above it, and profit per unit uses AC at that output, not MC.
Because barriers to entry protect the market, supernormal profit can persist in the long run. That is a major contrast with perfect competition and monopolistic competition, where entry tends to erode unusual profit. Monopoly does not guarantee supernormal profit, though. If demand is weak or costs are high, a monopolist may earn only normal profit or even make a loss.
This logic also explains why monopoly is usually associated with lower output and a higher price than in a more competitive market. The firm restricts quantity because expanding output would force price down.
Third-Degree Price Discrimination
Definition: Third degree price discrimination
Charging different prices to different groups of consumers for the same product, based on differences in price elasticity of demand.
This is not random price variation. The monopolist is separating customers into groups with different willingness to pay. Groups with more inelastic demand are charged a higher price because they are less responsive to a rise in price. Groups with more elastic demand are charged a lower price because they would cut demand sharply if price rose.
UK rail fares are a good example. Peak-time commuters often have relatively inelastic demand because they need to travel at specific times, so fares can be higher. Leisure travellers, students, and people booking further ahead tend to have more elastic demand, so firms offer cheaper tickets to attract them. Other common forms include regional pricing and age-based discounts.
Three conditions are needed. The firm must have market power, it must be able to split consumers into separate markets, and it must be able to stop arbitrage or resale between the cheap and expensive groups. If people can buy cheaply in one market and resell in another, the pricing structure collapses.
[DIAGRAM: asset_name: 3.4.5 - Monopoly - diagram 2; asset_slug: 3.4.5 - 2; recommended_method: retained_png; description: Retained source diagram supporting 3.4.5 - Monopoly; the packaged PNG preserves the original educational visual.]
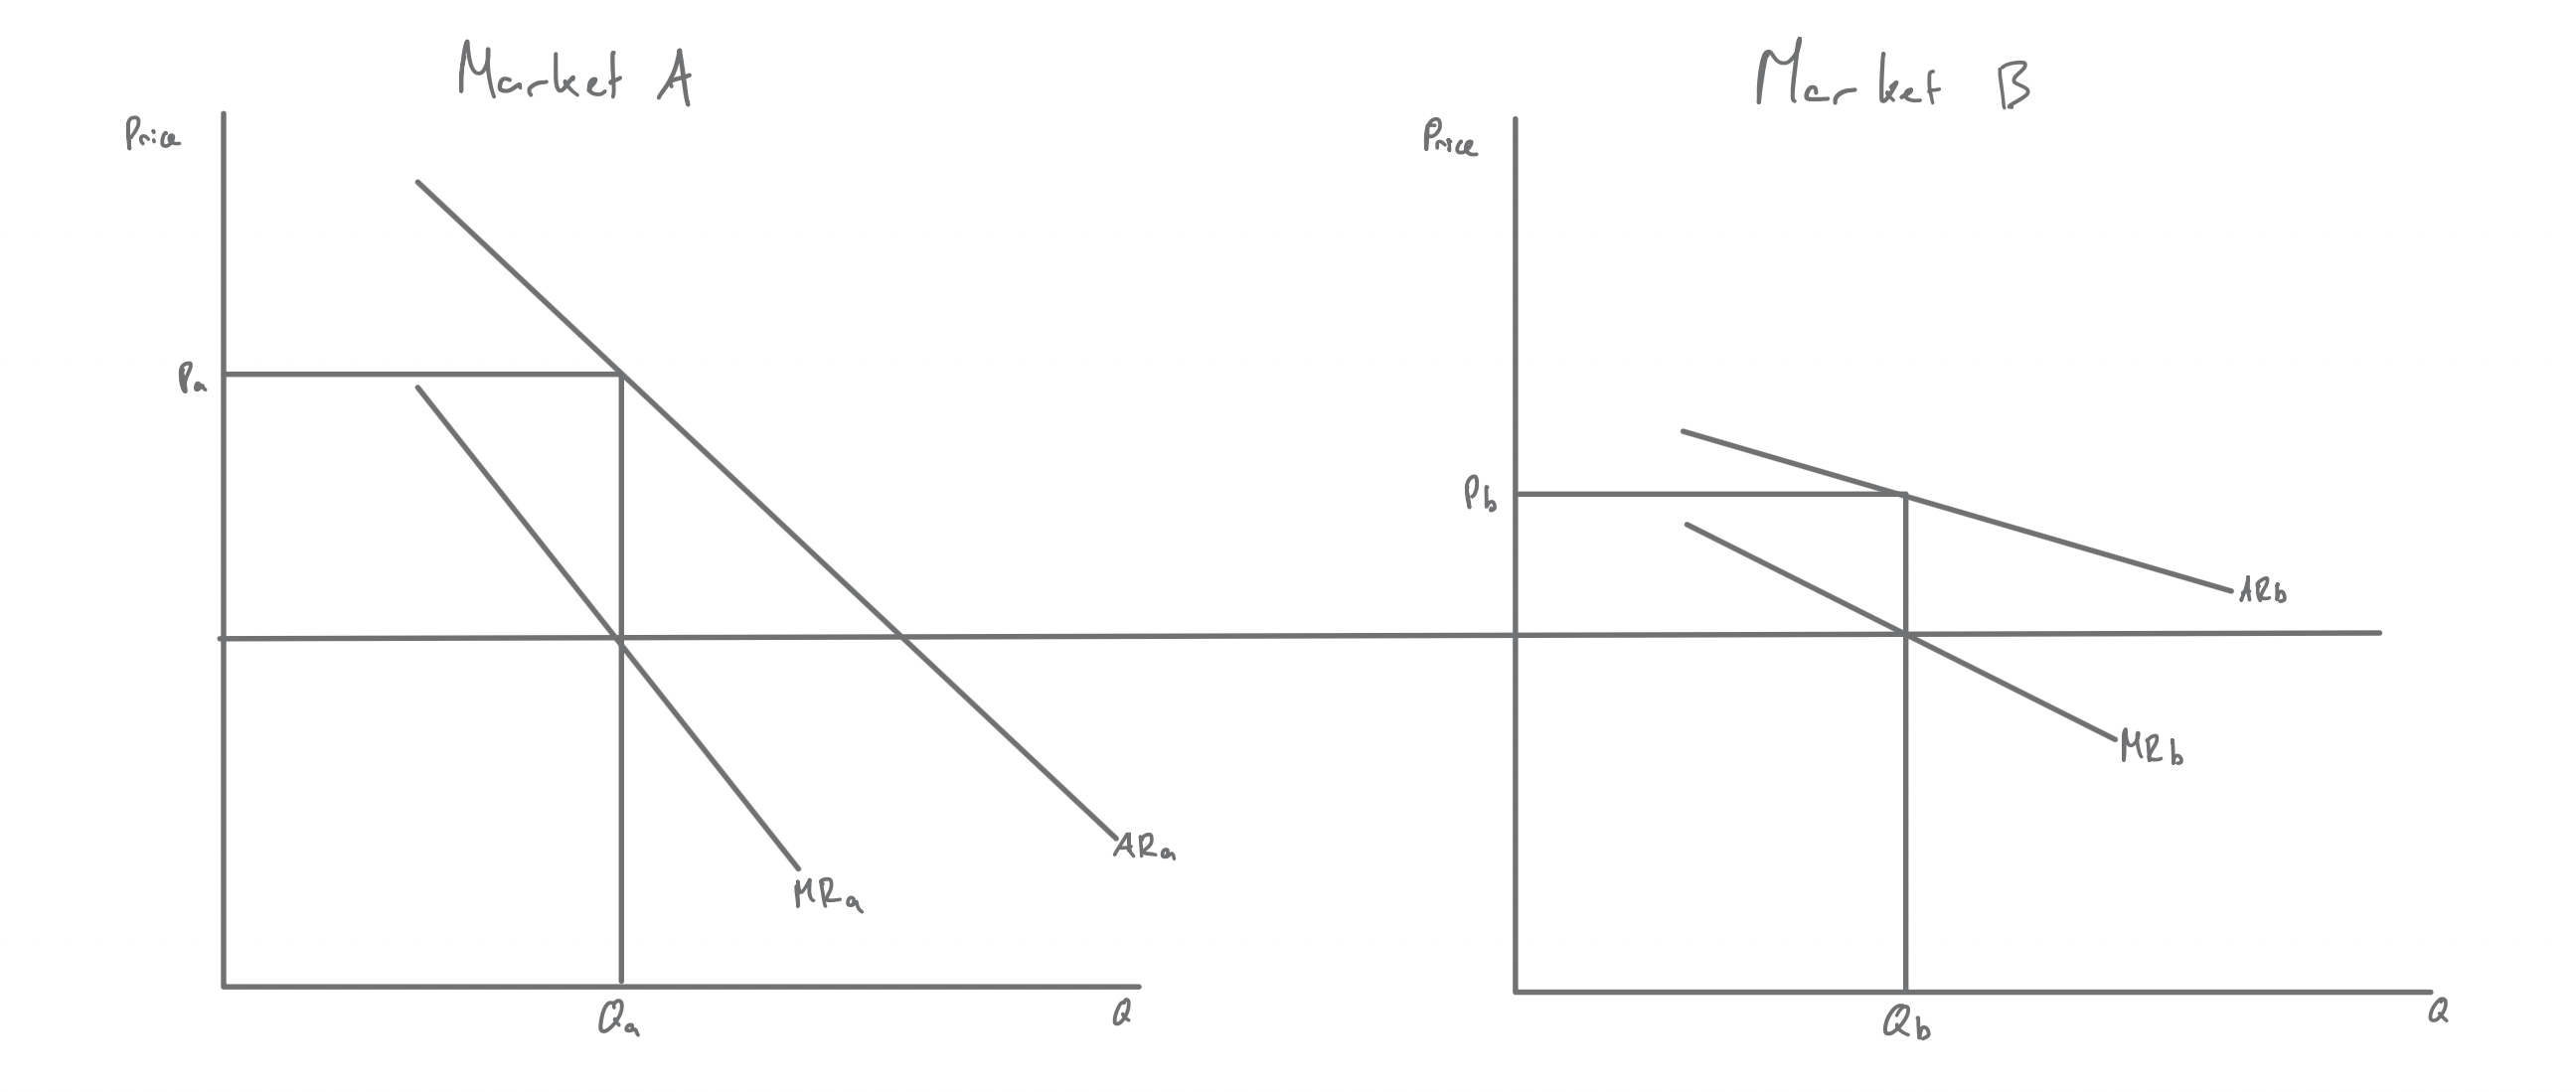
The diagram shows the key Edexcel rule. The horizontal line running across both markets is the firm's marginal cost, assumed constant and the same in each market. In each segmented market, the firm sells where MR = MC (at Qa and Qb), but it charges the price read from the relevant AR curve. Because Market A is less elastic, the price Pa is higher there than Pb in the more elastic Market B. So the same firm charges different prices because the two groups respond differently to price changes.
Continue this lesson.
You’re previewing NovaLearn without an account. Create a free account to read the rest.
Create free account