1.2.5 - Elasticity of supply
Demand is only half of the market story. When price changes, producers do not all respond by the same amount. Some firms can raise output quickly, while others are limited by time, capacity, stocks, or the difficulty of bringing in new resources. Elasticity of supply helps explain that difference.
What PES Measures
Definition: Price elasticity of supply (PES)
The responsiveness of quantity supplied to a change in price.
If price rises, profit-seeking firms will usually want to supply more. PES tells us how much more they are able to supply. A high PES means firms can respond strongly to the price signal. A low PES means they face constraints, so quantity supplied changes only a little.
PES is about a movement along a supply curve after a change in price. It is not the same as a shift in supply caused by something like higher costs, a tax, or bad weather.
The formula is:
This can also be written as:
Because supply usually rises when price rises and falls when price falls, PES is normally positive or zero. That makes it different from PED, which is usually negative.
Calculating and Classifying PES
The PES coefficient shows how strongly supply responds:
PES = 0: perfectly inelastic supply, so quantity supplied does not change at all0 < PES < 1: relatively inelastic supply, so quantity supplied changes by a smaller percentage than pricePES = 1: unit elastic supply, so quantity supplied changes by the same percentage as pricePES > 1: relatively elastic supply, so quantity supplied changes by a greater percentage than price- : perfectly elastic supply, so suppliers are willing to supply any amount at one price
A compact worked example makes the method clear. Suppose the price of steel rises from £500 to £550 per tonne, and quantity supplied rises from 10,000 tonnes to 11,500 tonnes per month.
Step 1: calculate the percentage change in price.
Step 2: calculate the percentage change in quantity supplied.
Step 3: apply the formula.
A PES of 1.5 means supply is relatively elastic. The percentage change in quantity supplied is bigger than the percentage change in price, so firms are quite responsive.
Exam tip
Put the percentage change in quantity supplied on top. Inverting the formula is the most common calculation error: here it would give 10% / 15% ≈ 0.67 and the wrong classification. PES is a pure number with no units or % sign, and its size compared with 1 is what tells you whether supply is elastic or inelastic.
[DIAGRAM: asset_name: 1.2.5 - Elasticity of supply - diagram 1; asset_slug: 1.2.5 - 1; recommended_method: retained_png; description: Retained source diagram supporting 1.2.5 - Elasticity of supply; the packaged PNG preserves the original educational visual.]
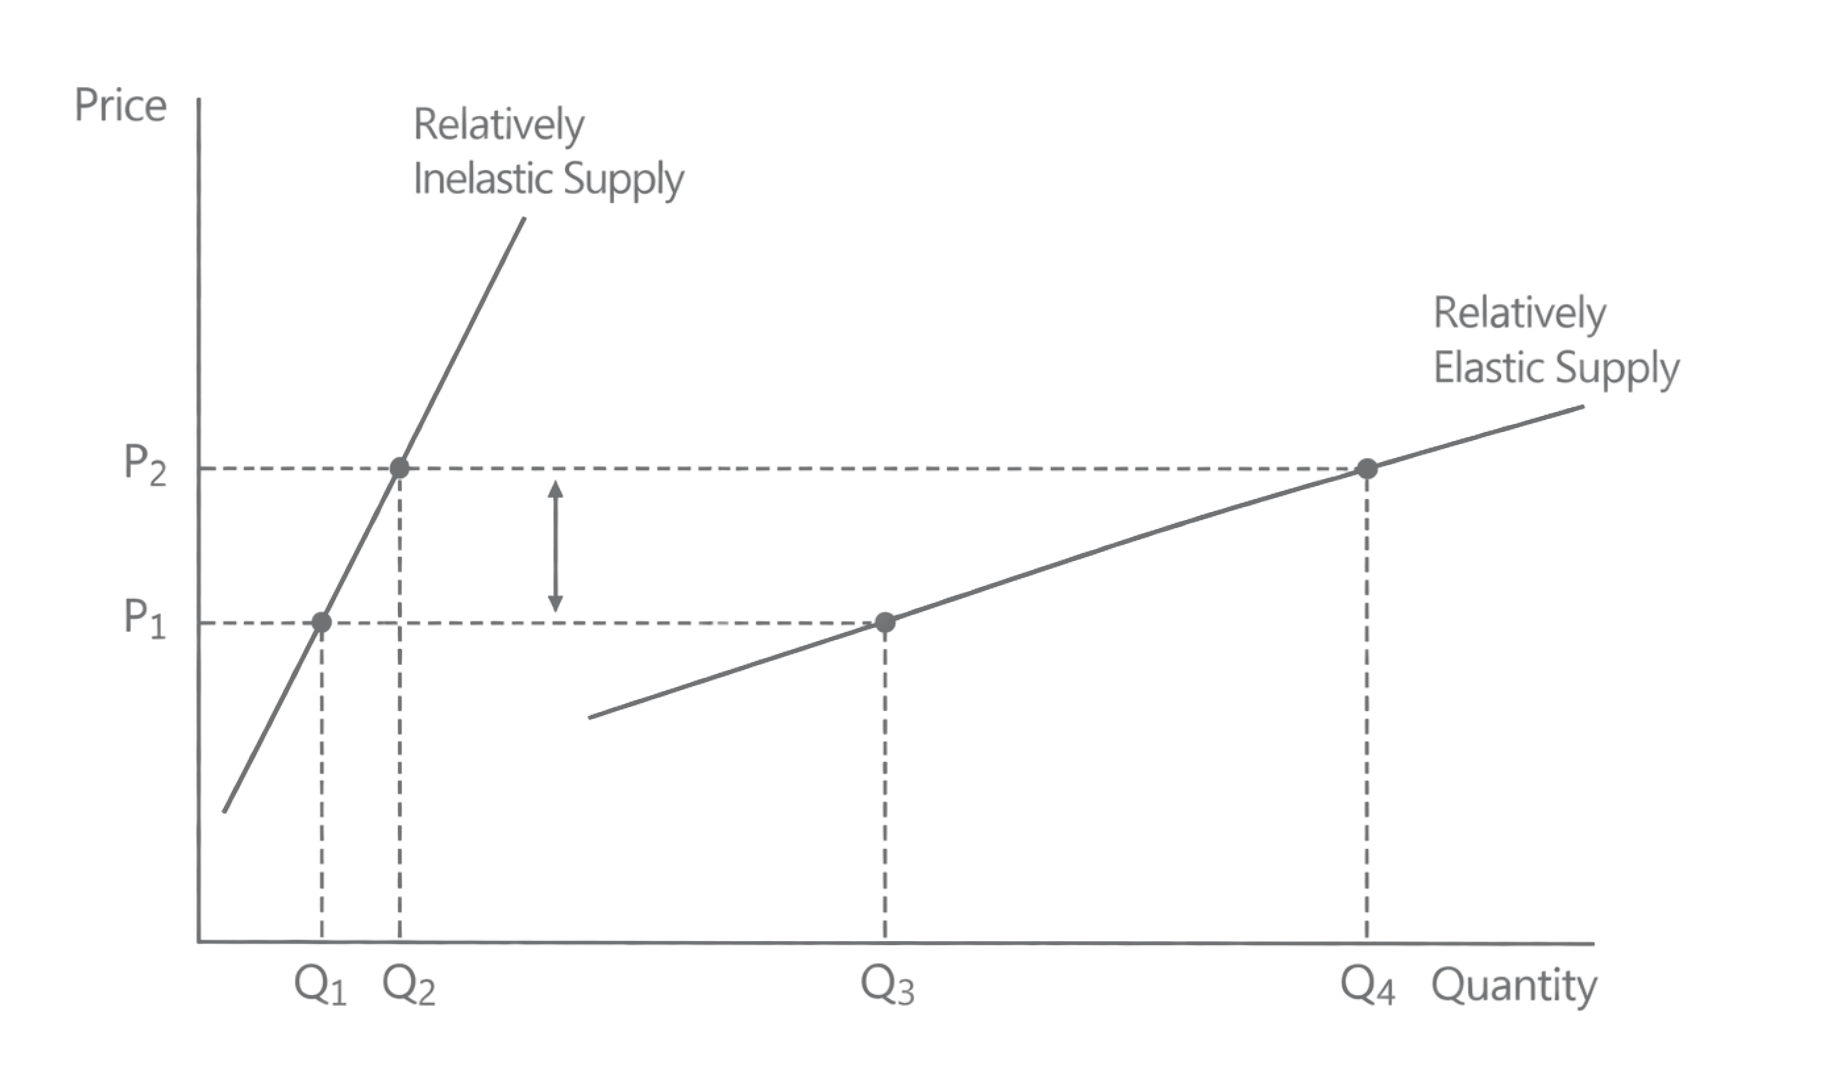
The diagram compares two supply curves facing the same price rise, from P1 to P2. On the steep curve, quantity supplied rises only from Q1 to Q2, so supply is relatively inelastic. On the flatter curve, the same price rise takes quantity supplied from Q3 to Q4, so supply is relatively elastic. Steepness is a quick visual guide when comparing curves over the same price range like this. Strictly, though, PES compares percentage changes, so it is not the same as slope: any straight-line supply curve that starts from the origin has a PES of exactly 1 all along it, however steep or flat it is drawn.
The extreme cases have their own shapes. Perfectly inelastic supply is a vertical line: the supply of original Picasso paintings is perfectly inelastic because no new originals can be produced. PES = 0 does not mean nothing is supplied; it means the quantity cannot change, whatever the price. Perfectly elastic supply is a horizontal line, a theoretical boundary case: suppliers offer any amount at one price, but nothing at all below it.
Why PES Differs Between Markets
PES depends on how easy it is for firms to expand output when price rises. Five influences matter especially often in exam answers.
Time period. This is usually the most important factor. In the short run, firms cannot fully adjust production, so supply tends to be relatively inelastic. In the long run, firms have more time to build capacity, train workers, or enter the market, so supply becomes more elastic.
Spare capacity. If a firm is operating below full capacity, it can increase output quite quickly by using idle machines, empty warehouse space, or underused labour. If it is already near full capacity, extra output may require new investment, so supply is less elastic.
Availability of stocks. If goods can be stored, firms can release inventories when price rises. That makes supply more elastic. Fresh fish or other perishable goods cannot be stored for long, so supply is more inelastic on a given day.
Mobility and substitutability of factors of production. If labour and capital can be switched between different products easily, firms can respond more quickly to a price rise. If production requires highly specialised machinery or rare skills, supply is less elastic.
Barriers to entry. Low barriers to entry allow new firms to join the market when prices and profits rise. High capital costs, legal restrictions, or long approval processes make supply less elastic.
Digital goods such as e-books or software downloads often have highly elastic supply because extra units can be provided at very low additional cost. Agricultural products such as wheat or coffee are much more inelastic in the short run because crops take time to grow.
Application
In the UK housing market, higher house prices do not quickly create more homes. Planning permission, land availability, skilled labour shortages, and the time taken to build mean quantity supplied responds only slowly at first. This is why a rise in demand for homes tends to push up house prices sharply rather than quickly increasing the number of homes built.
Exam tip
When asked which factor matters most, judge it for the market in the question. Time is often the deepest influence, because given time firms can relax the other constraints. But the binding constraint differs between markets: stocks only help if the good can be stored, spare capacity runs out if price keeps rising, and planning approval or specialist skills can stay binding for years.
Short Run and Long Run Supply
In economics, the short run means a period in which at least one factor of production is fixed. The long run means a period in which all factors of production can be varied. These are economic ideas, not fixed calendar lengths. For a small service business the long run may arrive quickly, but for housing, aircraft, or oil extraction it may take years.
Common mistake
Short run does not mean "a few weeks" and long run does not mean "many years". The distinction is about whether firms can vary all factors of production.
This matters because the same market can have different elasticities over time. If house prices rise suddenly, builders cannot instantly create more land, get planning approval, or finish new homes. Short-run supply is therefore relatively inelastic, though not perfectly inelastic: builders with spare capacity, or with land that already has planning permission, can still add some homes. Over a longer period, developers can buy land, arrange finance, hire workers, and complete more projects, so supply becomes more elastic.
The same logic applies in energy markets. If oil prices rise, North Sea producers cannot immediately drill new wells or bring new fields into production. Over time, however, higher prices can make new exploration and investment worthwhile, so supply is more responsive in the long run than in the short run.
Quick Recap
- PES measures how responsive quantity supplied is to a change in price.
- PES is usually positive or zero, and a higher PES means supply is more responsive.
- The main influences on PES are time period, spare capacity, stocks, mobility and substitutability of factors of production, and barriers to entry.
- Supply is often relatively inelastic in the short run but more elastic in the long run.