2.5.2 - Output gaps
Economies do not grow smoothly. Real GDP moves around its long-run trend, sometimes running above what is sustainable and sometimes below it. The output gap is the idea economists use to compare actual GDP with potential GDP and judge whether the economy is overheating, underperforming, or close to capacity.
Actual Growth and Trend Growth
Actual growth is the change in real GDP over a period. It is the growth rate we observe in the data, and it can fluctuate sharply from year to year as the economy expands or contracts.
Trend growth is different. It is the long-run sustainable rate at which the economy can grow without creating persistent inflationary pressure. It depends on the growth of the labour force, capital accumulation, productivity, and technological progress. In other words, trend growth reflects the economy's productive potential rather than just what happens this year.
The business cycle comes from the relationship between these two ideas. When actual growth runs above the trend for a period, the economy tends to heat up. When actual growth runs below the trend, the economy cools and spare capacity is more likely to appear.
Common mistake
Do not treat actual growth and trend growth as the same thing. Actual growth is the observed change in real GDP; trend growth is the underlying sustainable growth of productive capacity.
What an Output Gap Shows
An output gap is the difference between the actual level of GDP and the economy's estimated potential GDP. Potential GDP means the level of output the economy can sustain over time without generating persistent inflationary or deflationary pressure.
Formula: Output gap
The gap can be shown in pounds or as a percentage of potential GDP.
Worked example: if potential GDP is £2.5 trillion and actual GDP is £2.4 trillion, the output gap is trillion. As a percentage, that is , so the economy has a negative output gap.
A positive output gap exists when actual GDP is higher than potential GDP. The economy is producing above its sustainable capacity. That usually means unemployment has fallen below its natural rate, firms are using overtime or extra shifts, and labour and capital are being stretched more intensively than is sustainable in the long run. Because demand is pressing against limited capacity, inflationary pressure tends to build.
A negative output gap exists when actual GDP is lower than potential GDP. This means there is spare capacity in the economy. Unemployment is likely to be above its natural rate, offices and factories are underused, and workers, machines, and other resources are sitting idle. Because there is slack in the economy, price and wage pressure is usually weaker.
That is why the growth rate and the output gap must not be confused. Real GDP can still be rising while the economy remains below potential GDP, so positive growth does not automatically mean a positive output gap. The gap compares the level of actual GDP with potential GDP, while growth is a rate of change. For example, if actual GDP grows by 1% in a year while potential GDP grows by 2%, output is rising but a negative output gap gets wider. A negative gap only closes when actual growth runs above trend growth.
Showing Output Gaps on Diagrams
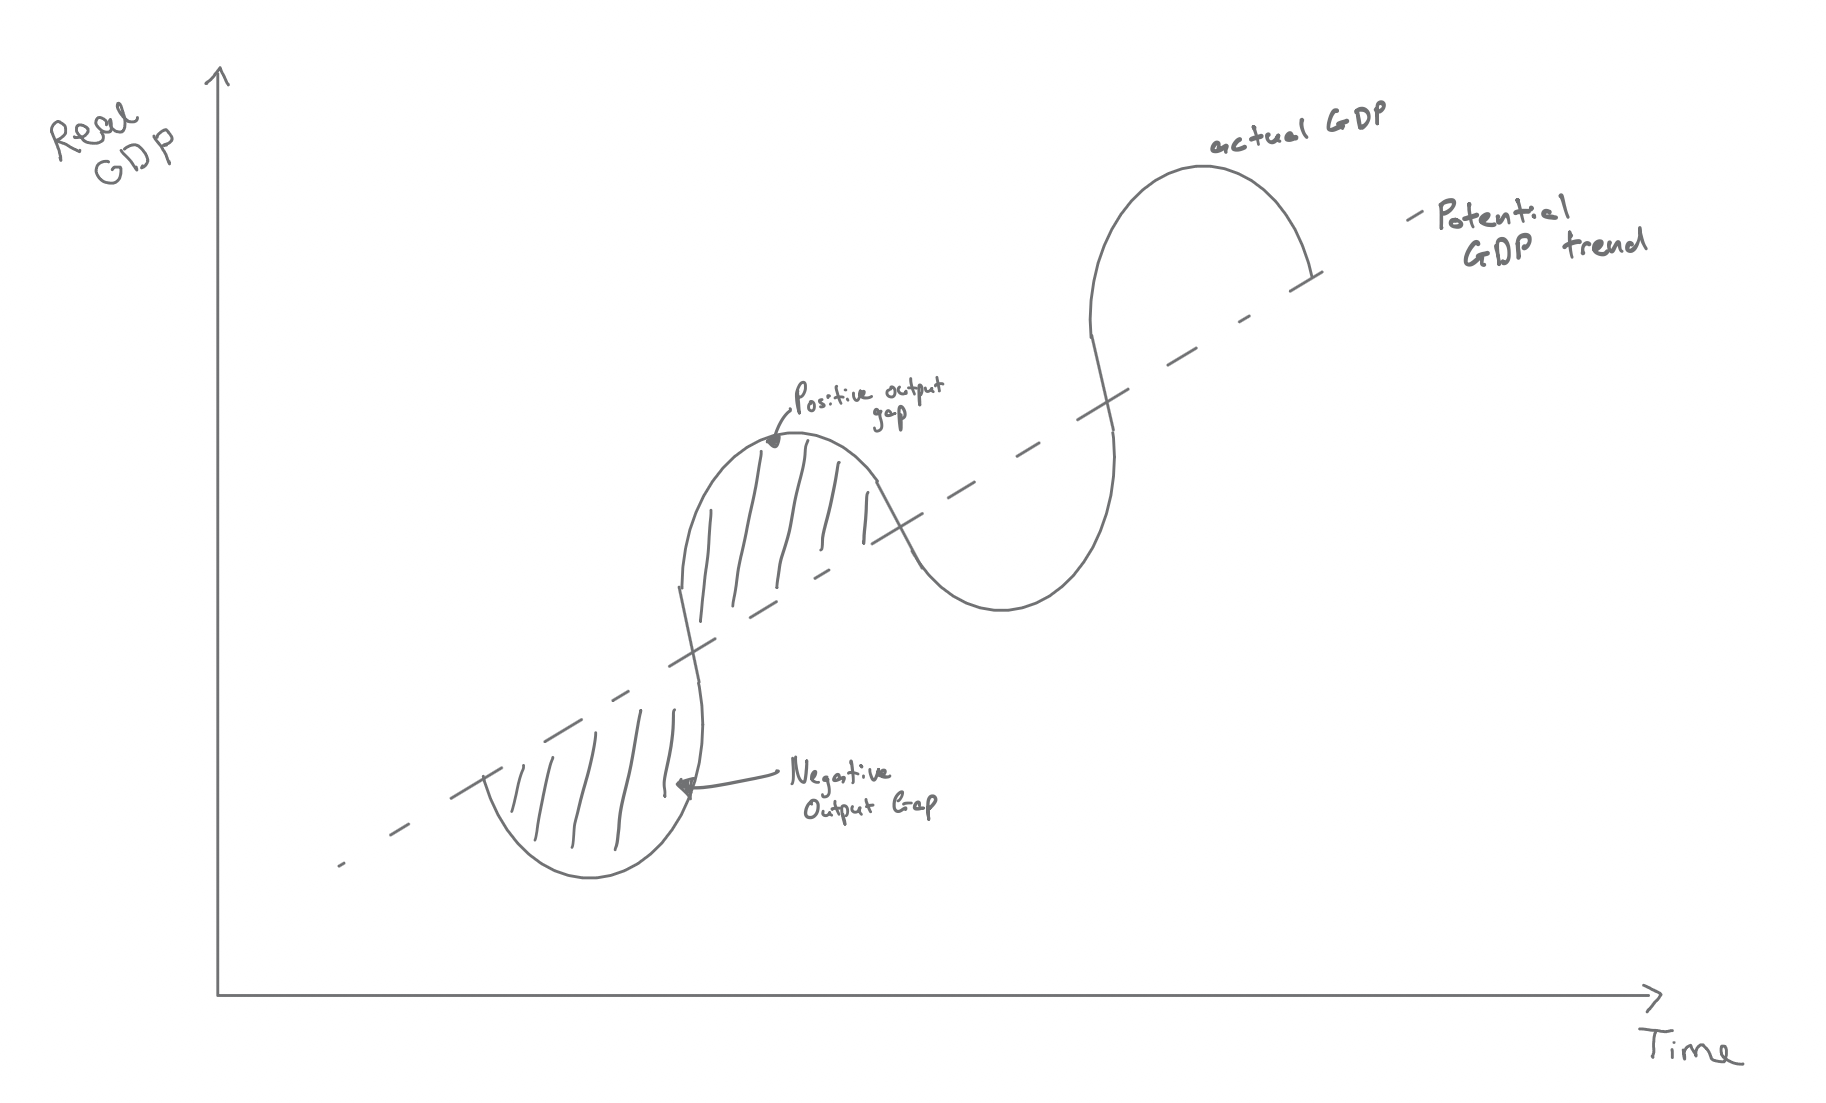
The trade cycle diagram plots real GDP against time. The solid curve shows actual GDP fluctuating around the dashed line labelled potential GDP trend, the long-run trend of productive potential. Whenever actual GDP is above the trend line, there is a positive output gap. Whenever it is below the trend line, there is a negative output gap. The shaded areas mark one negative and one positive gap. The peaks and troughs of the cycle are the points where the gaps are largest.
[DIAGRAM: asset_name: 2.5.2 - Output gaps - diagram 1; asset_slug: 2.5.2 - 1; recommended_method: retained_png; description: Retained source diagram supporting 2.5.2 - Output gaps; the packaged PNG preserves the original educational visual.]
Output gaps can also be shown using an AD/AS diagram. The vertical LRAS line marks the economy's full-capacity or potential output, often labelled . If aggregate demand is strong enough that equilibrium output is to the right of LRAS, actual output is above potential output and the gap is positive. If equilibrium output is to the left of LRAS, actual output is below potential output and the gap is negative. If AD intersects SRAS on LRAS, there is no output gap because actual output equals potential output.
[DIAGRAM: asset_name: 2.5.2 - Output gaps - diagram 2; asset_slug: 2.5.2 - 2; recommended_method: retained_png; description: Retained source diagram supporting 2.5.2 - Output gaps; the packaged PNG preserves the original educational visual.]
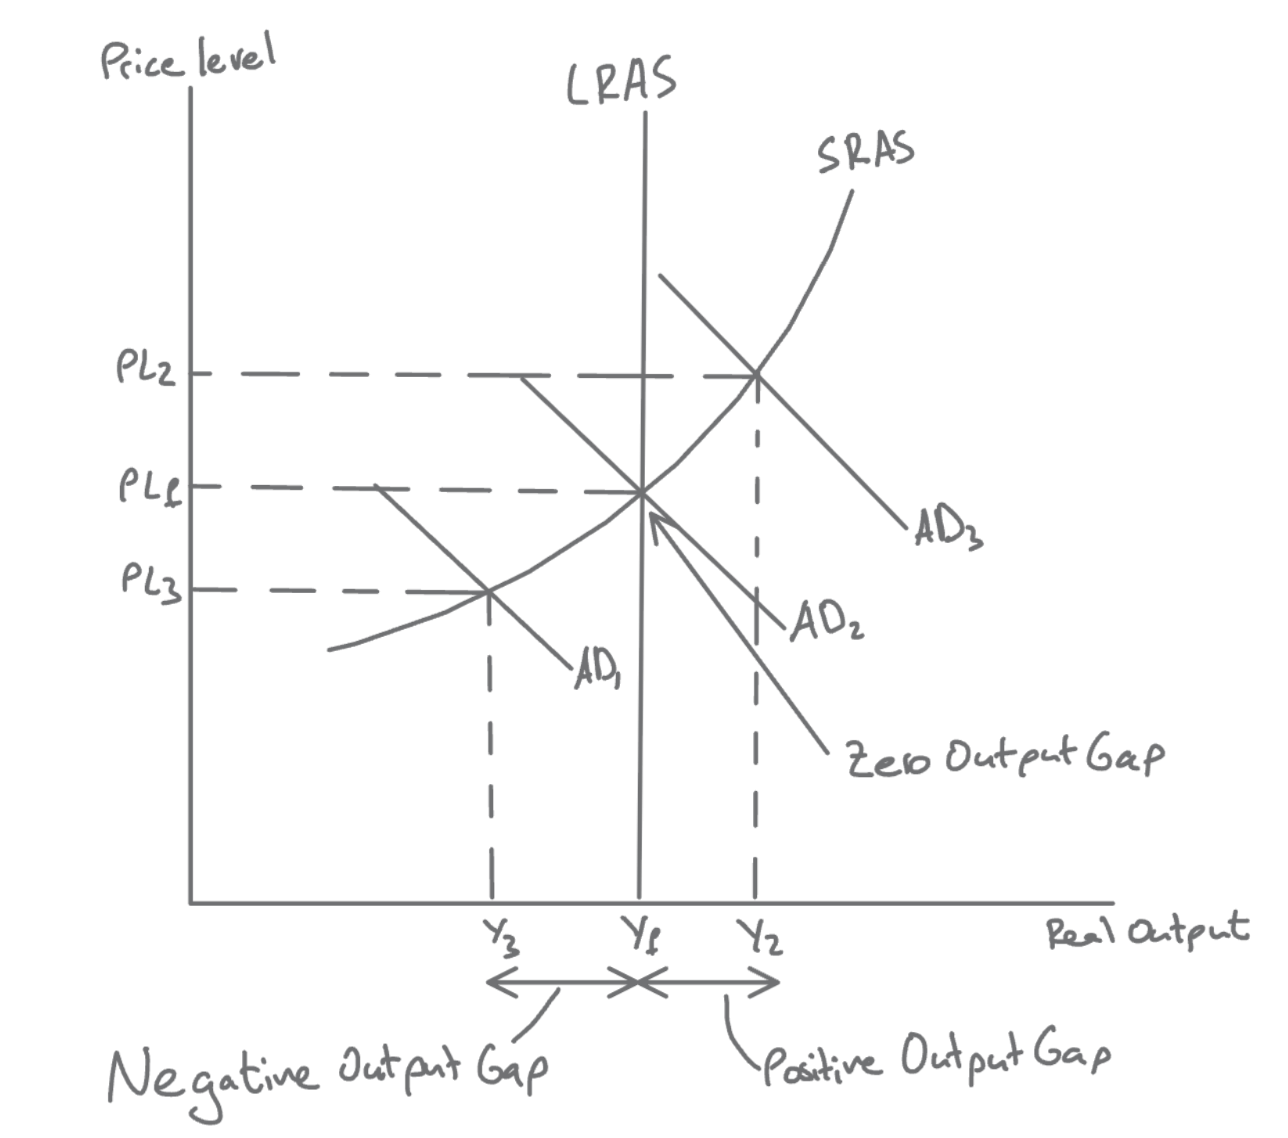
The diagram should be read economically, not mechanically. When AD3 meets SRAS to the right of LRAS, at Y2 and PL2, the output gap is positive; when AD1 meets SRAS to the left, at Y3 and PL3, the gap is negative; and where AD2 meets SRAS on LRAS, at Yf and PLf, actual output equals potential output so there is no output gap. Output to the right of LRAS suggests the economy is operating beyond sustainable capacity, so price and wage pressure is likely to rise. Output to the left of LRAS suggests spare capacity, weaker inflationary pressure, and higher unemployment.
Continue this lesson.
You’re previewing NovaLearn without an account. Create a free account to read the rest.
Create free account