2.13 - Sketching linear and quadratic graphs
Turn a line or quadratic rule into a clear sketch with its important coordinates labelled. You will use intercepts, the sign of a leading coefficient, symmetry and completed squares to show a graph's structure and interpret what it tells you.
Lines, gradients and intercepts
Can two different parabolas cross the -axis at exactly the same two points? By the end of this lesson you will know why the answer is yes, and what else a sketch needs to distinguish them. Start with the simpler case of a straight line.
You already know
A point lies on a graph when its coordinates satisfy the equation. Set to locate a point on the -axis; set to locate a point on the -axis. A function's domain contains its inputs and its range contains its outputs.
A sketch shows the correct shape and important features without requiring every point to be plotted to scale. A drawing on a grid uses the scale accurately. Both need labelled axes and the coordinates requested by the question.
Intercept
An intercept is a point where a graph meets a coordinate axis. An -intercept has ; a -intercept has . For example, is on the -axis. The point is on the -axis, so interchanging the coordinates changes the intercept.
In a straight-line rule, the coefficient of tells you how much changes when increases by .
Straight-line features
For a non-vertical straight line,
the gradient is , and the -intercept is . If , the -intercept is . If , the line is horizontal; it meets the -axis only when , when the whole line is that axis.
Not on the formulae sheet: learn it.
The sheet supplies a different useful form, , for a line through a known point. You will use that in coordinate geometry. Here, use intercepts to anchor a sketch.
Worked example 1: a rising line
Question. Sketch , labelling its intersections with the axes.
Plan. Read the gradient, set each coordinate to zero in turn and join the intercepts with a straight line.
Why this step? Two different points fix one straight line; the intercepts also provide the labels the question needs.
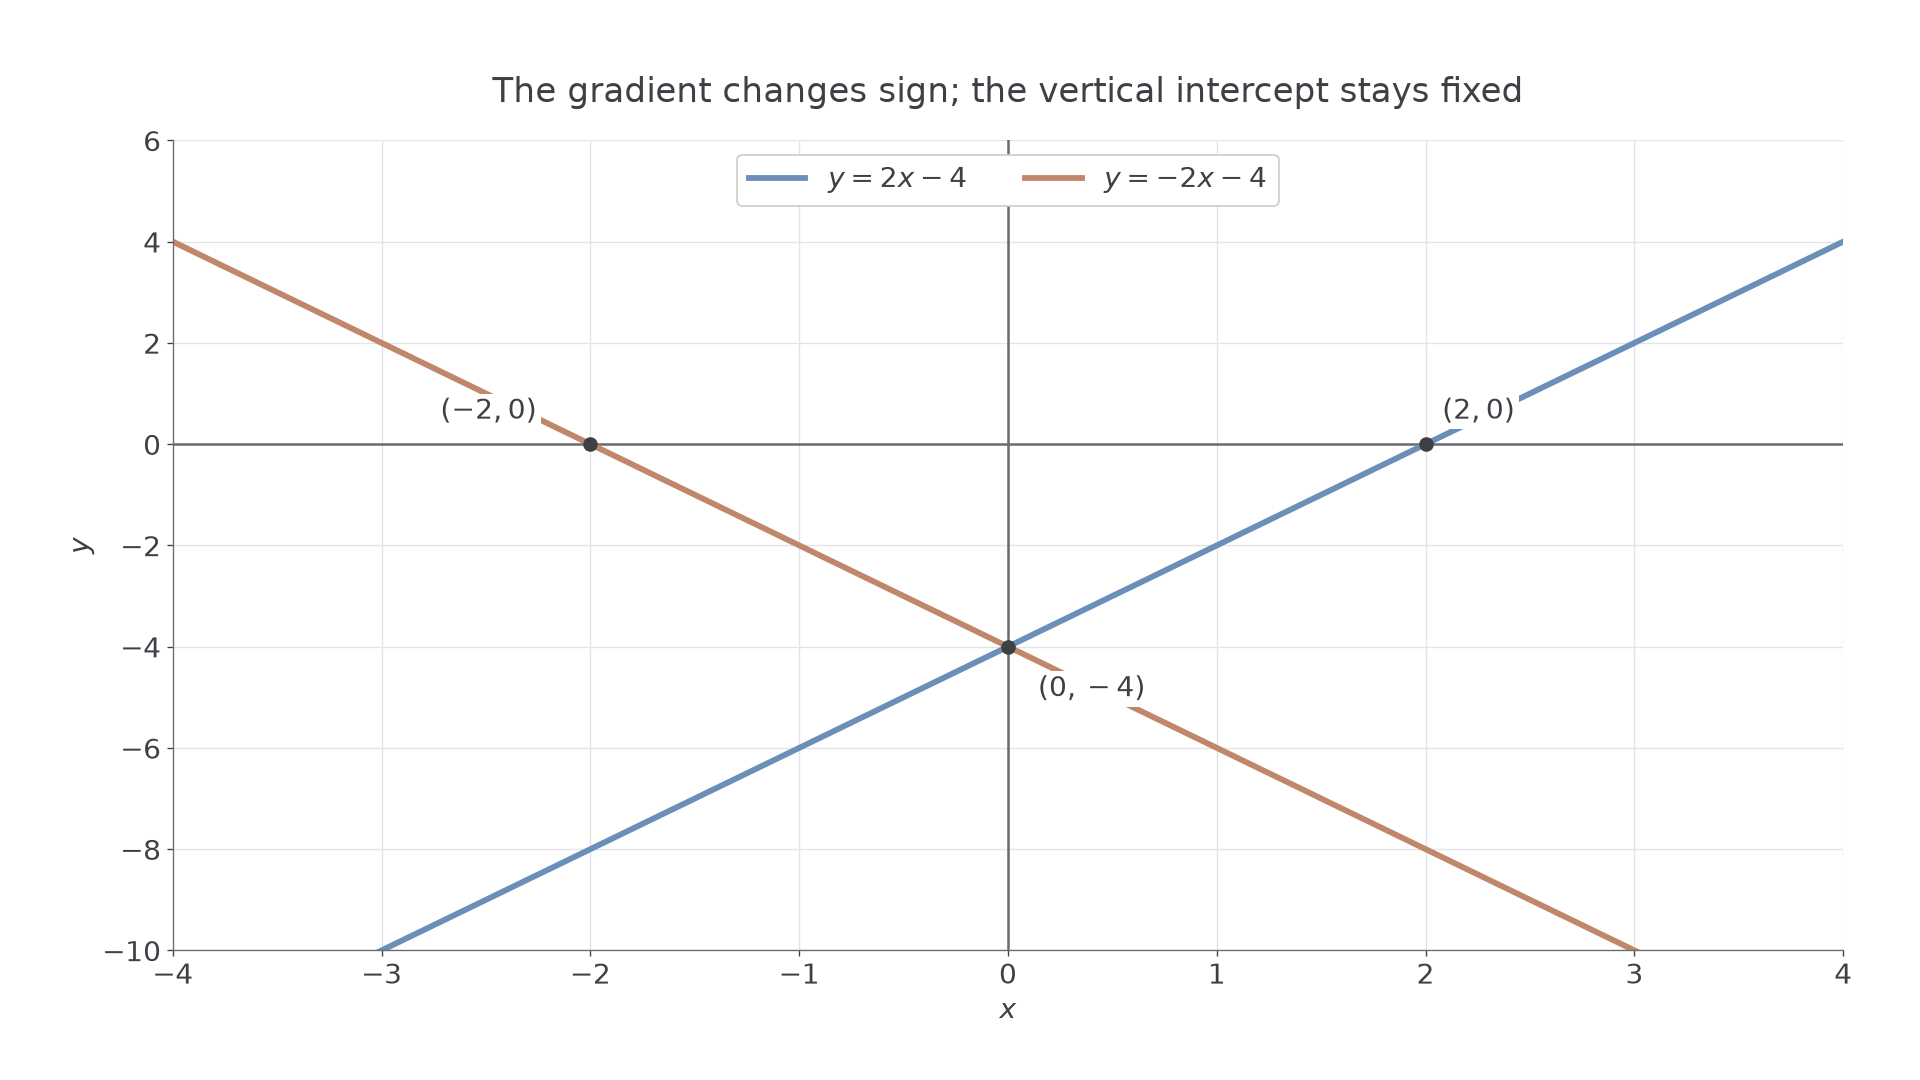
Answer. Draw a rising straight line through and , extending beyond both points, as shown below in blue.
Check. At , the rule gives , halfway between the two labelled intercepts.
Worked example 2 changes only the sign of the gradient. The line falls instead of rising, while its -intercept stays fixed.
Worked example 2: a falling line
Question. Sketch , labelling its intersections with the axes.
Plan. Use the same intercept method, retaining the negative coefficient.
Why this step? The negative gradient changes which side of the -axis contains the zero of the line.
Answer. Draw a falling straight line through and , shown below in clay.
Check. At , , halfway between its intercepts.
The picture compares the two lines on the same scales. To draw accurately on a grid, plot the labelled points at their actual coordinates, then use a ruler.
[DIAGRAM: asset_name: Gradient sign and line intercepts; asset_slug: l2fm-line-slope-sign; caption: Changing the gradient sign keeps the y-intercept but moves the x-intercept; description: A blue line y equals 2x minus 4 and a clay line y equals minus 2x minus 4 meet at (0, minus 4). Their x-intercepts are labelled (2, 0) and (minus 2, 0). Axes and a coordinate grid show one line rising and the other falling.]
A vertical line such as has undefined gradient and cannot be written as . This is why the straight-line feature rule specifies non-vertical lines.
If both intercepts are the origin, choose one extra point: passes through and . A single point would not fix the line's direction.
Watch out
Wrong: the -intercept of is . Right: it is , because on the -axis. Write coordinate pairs, not unlabelled numbers.
Now use a new line. The sign of the constant changes which side of the origin holds its vertical intercept.
Quadratic shape and axis intercepts
A quadratic graph is a smooth parabola; its leading coefficient controls whether it opens upwards or downwards, while solving its equation gives its axis crossings.
For , with , setting gives . Setting gives a quadratic equation, whose real solutions locate the -intercepts. There may be two, one or none. We will distinguish those cases using the turning point in the next part.
Quadratic shape and intercepts
For , with ,
Only real roots produce points on the coordinate graph.
Not on the formulae sheet: learn it.
Factorised form is particularly helpful: its zero factors reveal the -intercepts immediately. It does not make the graph a pair of straight lines; the product still gives a quadratic curve.
Worked example 3: intercepts of an upward parabola
Question. Work out all axis intercepts of , and state whether it opens upwards or downwards.
Plan. Substitute , then factorise the equation obtained from .
Why this step? The equation asks where the curve meets the horizontal axis, so both roots belong on that axis.
Answer. The intercepts are , and . The graph opens upwards because .
Check. Substitution gives and at the proposed roots.
Worked example 4 multiplies the whole rule by . The two roots stay the same, but the non-zero outputs reverse sign.
Worked example 4: the same roots with a different shape
Question. Work out all axis intercepts of , and state whether it opens upwards or downwards.
Plan. Read the new vertical intercept and take out a negative factor before solving .
Why this step? Multiplying a value by changes its sign, but zero remains zero, so the -intercepts do not move.
Answer. The intercepts are , and . The graph opens downwards because .
Check. At , the two examples give outputs and ; at both roots, each still gives .
Continue this lesson.
You’re previewing NovaLearn without an account. Create a free account to read the rest.
Create free account