2.13 - Exponential and piecewise graphs
Sketch exponential curves, work out their constants from points and interpret their outputs on a restricted domain. You will also draw functions with different rules on up to three parts of the domain, showing exactly which values belong at the joins.
Exponential growth, decay and the zero line
Can a curve keep falling forever without ever reaching zero? The graph does exactly that. Each step of in halves its height, but no finite number of halvings makes a positive height equal zero. We will return to this after studying graphs with quite different behaviour at their boundaries.
In , each increase of in doubles the output. This is a constant multiplier, rather than the constant addition you see in a straight line. The variable sits in the exponent.
Exponential function
An exponential function has a variable in the exponent, as in or . Here and are rational constants. For a graph defined for every real input, use . The non-constant exponential cases have and . For example, is exponential; is quadratic.
At , either exponent is zero, so either form gives . For positive , the curve stays above the horizontal axis. A negative reflects its outputs below that axis; it does not make a negative base suitable for all real inputs.
Exponential features
For and ,
When , the horizontal axis is a horizontal asymptote: the curve approaches it in one input direction. Since these powers are non-zero, the curve has no -intercept.
Not on the formulae sheet: learn it.
A horizontal asymptote describes a line the curve approaches as the input becomes arbitrarily large in one direction. For these exponential curves it is approached without being reached. Use a few exact points and the overall direction to anchor a smooth sketch.
Worked example 1: multiplying by two at each step
Question. Sketch , labelling its vertical intercept and stating its horizontal asymptote.
Plan. Calculate a few points, then draw a smooth increasing curve through them with its left tail approaching zero.
Why this step? Equal input steps give equal ratios, so the points belong to a curve with increasing steepness, not a straight line.
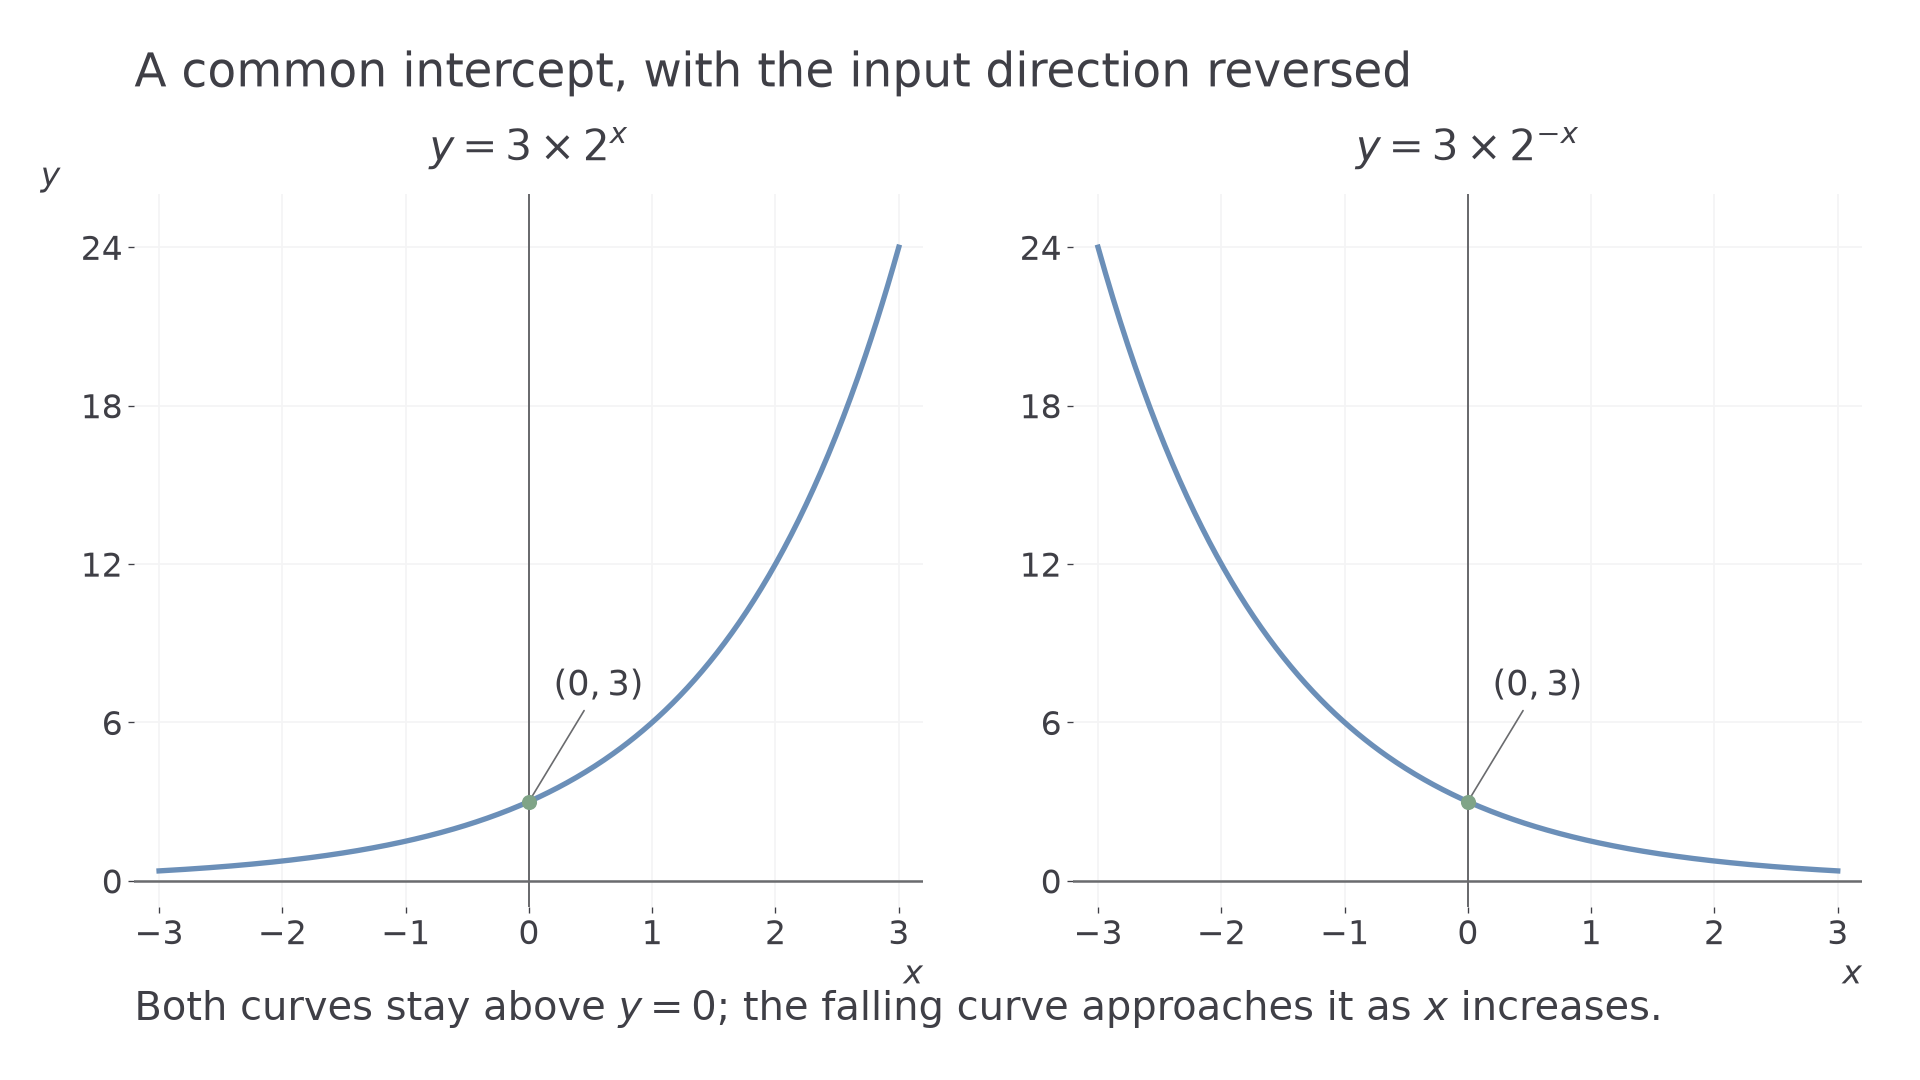
Answer. Draw the increasing curve shown in the left panel below, through . Its horizontal asymptote is ; there is no horizontal-axis crossing.
Check. The successive ratios are , and .
Worked example 2 changes only to in the exponent. Every output at a positive input now matches the old output at the corresponding negative input.
Worked example 2: halving at each step
Question. Sketch , labelling its vertical intercept and stating its horizontal asymptote.
Plan. Reverse the input direction of the first curve and calculate the corresponding points.
Why this step? The negative sign changes the input direction. It does not put a minus sign in front of the output.
Answer. Draw the decreasing curve shown in the right panel below, through . It approaches the asymptote as increases and has no horizontal-axis crossing.
Check. Each successive ratio is . Also, the first example at and this example at both give .
The two graphs use the same scales, so the reversal of input direction is visible.
[DIAGRAM: asset_name: Exponential directions; asset_slug: l2fm-exponential-directions; caption: Replacing x by minus x reverses the input direction while keeping the intercept at (0, 3); description: Two coordinate panels on identical scales. The left shows y equals 3 times 2 to the power x increasing, and the right shows y equals 3 times 2 to the power minus x decreasing. Both label (0, 3), stay above y equals 0 and approach that line in opposite input directions.]
The exceptions are simple: if , the rule is the constant ; if and , it is . For negative , such as , every output is negative and is the vertical intercept.
Watch out
Wrong: , or . Right: only the is raised to the power . Keep the multiplier outside the power.
Use the same decreasing-curve features with a different multiplier and base.
Working out constants from two points
Substitute the two given points into the stated form, then divide the resulting equations to remove the common multiplier.
A point is especially convenient: it gives immediately, because . If neither point has input zero, taking a ratio removes instead. Use the difference in the inputs to work out the exponent of . These parameter methods are not supplied on the formulae sheet: learn them.
Worked example 3: neither input is zero
Question. The graph passes through and , where and are rational and . Work out and .
Plan. Substitute both points, divide the second equation by the first and take the positive square root.
Why this step? Dividing cancels the same non-zero multiplier . The two-step change in input means the ratio is , not .
Answer. , .
Check. and , matching both points.
Worked example 4 changes only the stated form to , keeping the two points. The ratio now gives a negative exponent of .
Worked example 4: the negative-exponent form
Question. The graph passes through and , where and are rational and . Work out and .
Plan. Substitute as before, but retain the minus signs in the exponents when dividing.
Why this step? A negative exponent does not guarantee decay: here , so , and the graph increases.
Answer. , .
Check. and . This is exactly the same curve as in Worked example 3, written in a different stated form.
Decide which form the question supplies before interpreting the multiplier. For , increases while decreases; for , these directions reverse.
Watch out
Wrong: the outputs change from to , so . Their inputs differ by , not . Right: for the positive-exponent form, , so . For the negative-exponent form, , so .
The next points have the same input spacing. Follow the negative-exponent form exactly as written.
Exponential ranges on restricted domains
Use the curve's direction to decide which endpoint gives the lowest output, then preserve each endpoint's inclusion sign.
You already know
A domain describes inputs, and a range describes outputs. Use or in a range, rather than . An excluded endpoint value is only a boundary unless some other allowed input produces that same output.
Continue this lesson.
You’re previewing NovaLearn without an account. Create a free account to read the rest.
Create free account