2.1.5(c)(i)-(ii) - Factors affecting membrane permeability
Membranes are not fixed plastic bags around cells. Their phospholipids and proteins move, and their structure can be disturbed by conditions such as temperature and solvents. In this lesson you will learn how those conditions affect permeability, and how beetroot practicals use pigment leakage and colorimetry to turn membrane damage into quantitative evidence.
Permeability and structure
Permeability means how easily substances can pass through a membrane. A membrane with low permeability lets few of a particular substance through. A membrane with higher permeability lets more through, or lets it through faster.
Membrane permeability
The extent to which substances can pass through a membrane.
The membrane structure from the fluid mosaic model gives the reason. Phospholipid tails form a hydrophobic interior, while proteins are embedded in or attached to the bilayer. These parts are held together by many weak interactions, so the membrane is stable enough to act as a barrier but fluid enough for molecules in the membrane to move sideways.
Temperature changes that balance. At low temperature, phospholipids have less kinetic energy and move less, so the membrane becomes less fluid. As temperature rises, phospholipids have more kinetic energy and move more, increasing membrane fluidity. At high temperatures, the bilayer can become disrupted and membrane proteins can denature, so the membrane becomes much more permeable.
Solvents also affect membrane structure. Ethanol is a common example in practical work. It can disturb the arrangement of phospholipids and disrupt the bilayer, so substances that were previously retained inside the cell leak out more easily.
The careful wording is "more permeable", not "fully destroyed". A membrane can become leakier without every membrane component disappearing. The practical question is how much leakage occurs under each condition.
Beetroot as a model
Beetroot is useful because its cells contain a red-purple betalain pigment in the vacuole. In an intact living cell, that pigment is held behind membranes: the vacuole membrane, called the tonoplast, and the cell-surface membrane.
If beetroot tissue is placed in water or ethanol and the membranes remain intact, little pigment should enter the surrounding solution after the initial pigment from cut cells has been washed away. If the membranes are disrupted, more pigment leaks out. The surrounding liquid becomes more coloured.
This is why cutting and washing matter. Cutting beetroot ruptures some cells at the cut surface, so pigment leaks from damaged cells even before the factor being tested has acted. Washing the pieces removes this pigment from the cut surface. Then later colour change is a better measure of membrane permeability under the test condition.
The cell wall is not the barrier being tested. Plant cell walls are freely permeable to many dissolved substances. The important conclusion is about membranes: the cell-surface membrane and tonoplast have become more permeable.
In a beetroot membrane practical, absorbance is used as a proxy for pigment concentration in the surrounding liquid. A higher absorbance reading means more pigment has leaked out, if the same colorimeter settings, blank and sample volume are used.
Now connect the biological model to the practical evidence.
Designing the investigation
A good membrane-permeability investigation changes one factor and measures pigment leakage. For temperature, the independent variable is the temperature of the water bath. For solvent, it could be ethanol concentration or detergent concentration. The dependent variable is usually colour intensity or absorbance of the surrounding solution.
| Practical decision | Why it matters |
|---|---|
| Use equal-sized beetroot pieces | Keeps surface area and volume similar, so leakage is comparable |
| Use beetroot from the same part, variety and age where possible | Reduces differences in pigment concentration and tissue structure |
| Wash cut pieces before the test | Removes pigment from cells damaged by cutting |
| Keep exposure time and solution volume constant | Makes the amount of leakage comparable between conditions |
| Use the same colorimeter filter or wavelength and the same blank | Makes absorbance readings comparable |
| Repeat each condition | Allows a mean to be calculated and anomalies to be identified |
For solvent concentration, serial dilution is a sensible way to produce a range such as 0%, 20%, 40%, 60%, 80% and 100% ethanol. The exact range must be safe and appropriate for the laboratory, and ethanol should be kept away from flames. Scalpels or cork borers can cut, so tissue cutting needs careful handling and a suitable cutting surface. Hot water baths can burn, so tubes should be handled with care.
Colorimeter technique is also part of the evidence. The cuvette should be clean and correctly orientated, the liquid should not contain pieces of beetroot, and the colorimeter should be zeroed using a suitable blank, often the solvent or water without pigment. If a blue-green filter or wavelength is used for red-purple pigment, it should be used consistently for every sample.
When asked for controlled variables, do not list variables already fixed by the stem. Give two other variables and make them specific, such as "same diameter and length of beetroot cylinders" rather than just "same size".
The next check is about practical design, not memorising one fixed recipe.
Processing the data
The raw observation might be colour intensity, but the stronger evidence is numerical. A colorimeter gives absorbance in arbitrary units or absorbance units. The first processing step is often to calculate a mean absorbance for each temperature or solvent concentration.
Calculating a mean absorbance
Three repeat absorbance readings at 60% ethanol are 0.42, 0.45 and 0.43 absorbance units.
To a suitable number of decimal places, the mean absorbance is 0.43 absorbance units.
Biological interpretation: more pigment has leaked at 60% ethanol than at a lower concentration if the lower concentration has a lower mean absorbance under the same method.
The graph type matters. Temperature and ethanol concentration are continuous variables, so a line graph or scatter graph with a line/curve of best fit is usually more appropriate than a bar chart. Axes need quantities and units: for example, temperature / degree C on the x-axis and absorbance / arbitrary units on the y-axis.
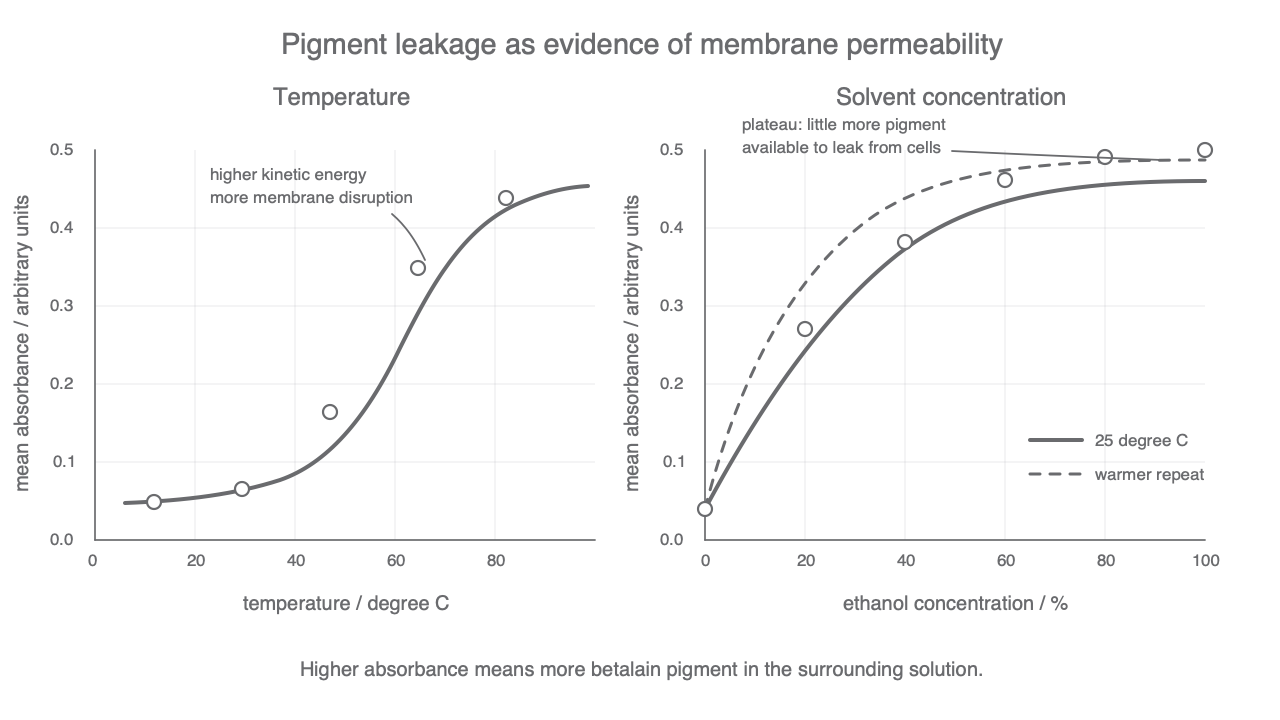
OCR often expects students to explain the shape of a graph. With increasing ethanol concentration, absorbance normally increases because membranes become more permeable and more pigment leaks out. The curve may then level off because all or nearly all releasable pigment has left the cells, or because pigment concentration inside and outside the cells has reached equilibrium.
Increasing the temperature during the same ethanol experiment would be expected to shift the curve left or make pigment leak at lower ethanol concentrations, because temperature also increases membrane permeability. It should not keep rising forever above the maximum amount of pigment available.
[DIAGRAM: permeability_trends: Lesson 042: Factors affecting membrane permeability - diagram 01; asset_slug: 042_m02_1_5_factors_affecting_membrane_permeability__diagram_01; recommended_method: drawn_biology; description: 16:9 two-panel grey line graph showing expected absorbance trends for beetroot pigment leakage against temperature and ethanol concentration, including a plateau where most pigment has leaked.]
If absorbance is measured over time, the initial rate of pigment leakage can be estimated from the gradient of an absorbance-time graph. For a straight section:
Rate from a graph
For a curve, draw a tangent at the point of interest and calculate its gradient. That is a data skill, not a new membrane mechanism.
Use the graph idea in the next check.
Valid conclusions
A valid conclusion links the result to membrane permeability and stays within the evidence. For example:
Increasing ethanol concentration increased mean absorbance, so more pigment leaked from the beetroot cells. This supports the conclusion that ethanol increases membrane permeability.
That conclusion is stronger if the method controlled relevant variables, used repeats and considered uncertainty. Repeats do not automatically make a result accurate. They help calculate a mean, identify anomalous readings and improve repeatability.
Uncertainty matters because small differences in absorbance may not be meaningful. If a colorimeter reading is 0.40 absorbance units with an uncertainty of +/-0.01, the percentage uncertainty is:
If two means differ by less than the uncertainty and their repeats vary widely, it would be risky to claim a real difference in permeability.
Some practical improvements target validity: use a thermostatically controlled water bath, keep ethanol volume constant, rinse cut surfaces consistently, remove beetroot pieces before colorimeter readings, and use the same blank. Other improvements target repeatability: use more replicates, calculate a mean, and investigate anomalous readings rather than simply hiding them.
In membrane-permeability practicals, absorbance is evidence for pigment leakage, pigment leakage is evidence for increased membrane permeability, and the method decides how strongly that conclusion can be trusted.
Now test whether you can keep the claim precise.
Putting it together
The whole lesson fits into one evidence chain:
- Membrane structure depends on the arrangement and movement of phospholipids and proteins.
- Temperature and solvents can disrupt this structure.
- Disruption makes membranes more permeable.
- In beetroot, increased permeability allows betalain pigment to leak from the vacuole and cell.
- Colorimeter absorbance gives quantitative evidence of pigment leakage.
- Good controls, repeats, graphs and uncertainty handling decide how reliable the conclusion is.
This is also the boundary of the lesson. The next membrane lessons deal with movement mechanisms such as diffusion, active transport and osmosis. Here, the focus is the structure of the membrane becoming more or less permeable, and how that can be investigated.