2.1.4(f) - Enzyme inhibitors and end-product inhibition
Enzyme inhibitors reduce the rate of enzyme-controlled reactions, but they do this in different ways. In this lesson you will learn how to distinguish competitive and non-competitive inhibition, how reversible and non-reversible inhibition affect enzyme activity, and how end-product inhibition controls metabolic pathways. The practical thread is OCR PAG4-style enzyme-rate evidence: rate calculations, controlled variables, graph interpretation, and uncertainty.
Inhibitors and rate
An enzyme-controlled reaction depends on successful collisions between substrate molecules and active sites. An inhibitor is a substance that reduces enzyme activity, so fewer substrate molecules are converted into product per unit time.
Inhibitor
A substance that reduces the rate of an enzyme-controlled reaction by interfering with enzyme action.
In OCR Biology, the key effect to track is rate. Rate can be measured as product formed per unit time, substrate used per unit time, or, in an endpoint method, the reciprocal of the time taken for a visible change.
Reaction rate
For example, if catalase produces oxygen from hydrogen peroxide, a gas syringe could measure the volume of oxygen produced in a fixed time. If amylase breaks down starch, iodine could be used to find the time taken until starch is no longer detected. In each case, a lower rate means the enzyme is making product more slowly; it does not automatically mean every enzyme molecule has been destroyed.
Calculating percentage inhibition
A reaction without inhibitor produces 24.0 cm3 of gas in 120 s.
The same reaction with an inhibitor produces 12.0 cm3 of gas in 120 s.
The inhibitor has halved the measured reaction rate under these conditions.
Now use the same comparison on a second dataset, keeping the units consistent before calculating the percentage change.
Competitive inhibition
A competitive inhibitor competes with the substrate for the enzyme's active site. It has a shape that allows it to fit into the active site, but it is not converted into the normal product. While the inhibitor occupies the active site, the substrate cannot bind there, so fewer enzyme-substrate complexes form per second.
Competitive inhibitor
An inhibitor that binds at the active site and prevents the substrate from binding to that active site.
The word competitive matters. If substrate concentration is increased, substrate molecules are more likely to collide with and occupy active sites before inhibitor molecules do. This means the effect of a reversible competitive inhibitor can be reduced by increasing substrate concentration.
Do not write that competitive inhibition changes the enzyme's active site shape as the main explanation. The usual OCR-level explanation is active-site competition: inhibitor and substrate cannot both occupy the same active site at the same time.
For a competitive inhibitor, link the mark-scheme words in a chain: similar shape to substrate, binds to active site, fewer enzyme-substrate complexes form, increasing substrate concentration reduces the inhibitor's effect.
The next check is asking for that chain of reasoning, not just the word "competitive".
Non-competitive inhibition
A non-competitive inhibitor binds to a site on the enzyme other than the active site. This site is often called an allosteric site. Binding changes the enzyme's shape or function so that the active site no longer catalyses the reaction effectively.
Non-competitive inhibitor
An inhibitor that binds away from the active site and reduces enzyme activity by changing enzyme shape or function.
Because the inhibitor is not simply competing for the active site, adding more substrate does not fully overcome non-competitive inhibition. Even if substrate molecules are abundant, inhibited enzyme molecules cannot catalyse normally, so the maximum possible rate is lower.
[DIAGRAM: inhibitor_rate_curves: Lesson 40: Enzyme inhibitors and end-product inhibition - diagram 01; asset_slug: 040_m02_1_4_enzyme_inhibitors_and_end_product_inhibition__diagram_01; recommended_method: drawn_biology; description: 16:9 line graph comparing reaction rate against substrate concentration for no inhibitor, reversible competitive inhibitor and non-competitive inhibitor, with OCR-safe labels and grey NovaLearn styling.]
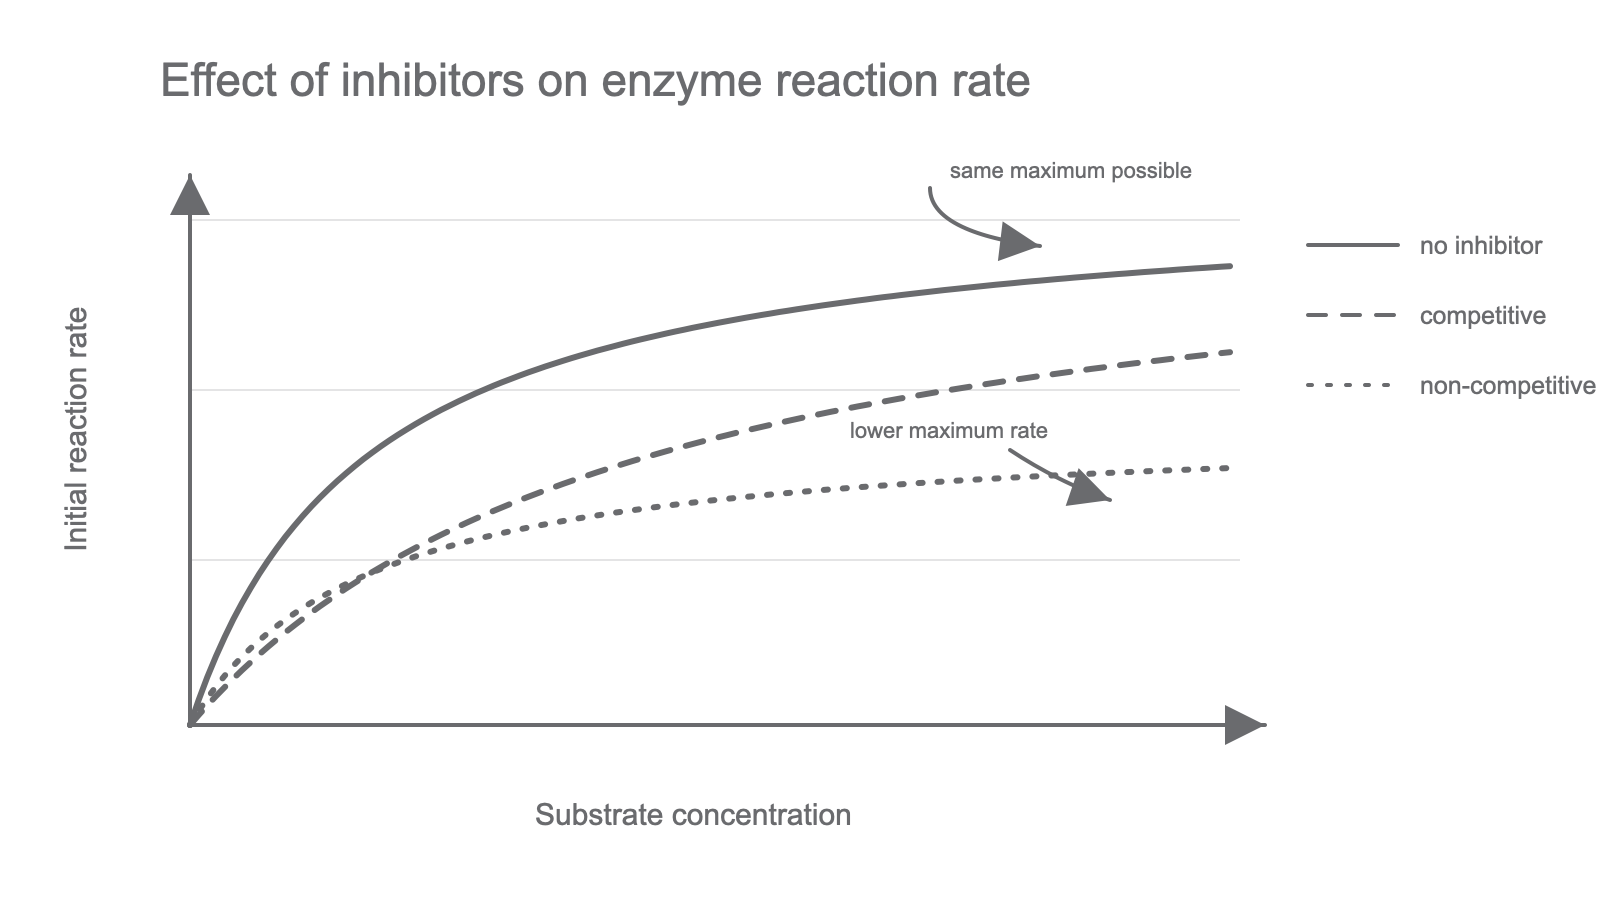
Read the graph as a story about active enzyme. With no inhibitor, rate rises as substrate concentration rises, then levels off when active sites are saturated. With a competitive inhibitor, the curve is lower at low and intermediate substrate concentrations but can approach the same maximum rate if enough substrate is supplied. With a non-competitive inhibitor, the plateau is lower because some enzyme activity has been removed from the reaction.
Reversible and non-reversible inhibition
Competitive and non-competitive describe where or how the inhibitor acts. Reversible and non-reversible describe whether the inhibition can readily be undone.
In reversible inhibition, the inhibitor can leave the enzyme. If the inhibitor is removed or diluted, enzyme activity can recover because the enzyme molecule itself is still functional. Many competitive inhibitors are taught as reversible because they bind temporarily to active sites, but reversible inhibition can also involve allosteric binding.
In non-reversible inhibition, sometimes called irreversible inhibition, the affected enzyme molecule does not readily regain normal activity when the inhibitor is removed. The cell or experimental mixture would need new active enzyme molecules for full activity to return.
| Feature | Reversible inhibition | Non-reversible inhibition |
|---|---|---|
| Binding effect | Inhibitor can leave enzyme | Inhibitor remains bound or leaves lasting enzyme damage |
| Recovery if inhibitor is removed | Rate can increase again | Rate remains low until active enzyme is replaced |
| OCR-safe data clue | Activity returns after dilution or removal | Activity does not return after dilution or removal |
In an experiment, do not identify reversibility from one low-rate result alone. You need evidence of recovery after the inhibitor is removed, diluted, or compared with a fresh enzyme sample. That is an HSW-style evidence point: the conclusion depends on the method.
End-product inhibition
Cells often make substances through metabolic pathways. In a pathway, the product of one enzyme-controlled reaction becomes the substrate for the next reaction. End-product inhibition is a feedback mechanism in which the final product inhibits an enzyme earlier in the pathway.
[DIAGRAM: end_product_inhibition_pathway: Lesson 40: Enzyme inhibitors and end-product inhibition - diagram 02; asset_slug: 040_m02_1_4_enzyme_inhibitors_and_end_product_inhibition__diagram_02; recommended_method: drawn_biology; description: 16:9 flow diagram showing substrate A converted through enzymes 1-3 to final product D, with D feeding back to bind an allosteric site on enzyme 1 and reduce pathway rate.]
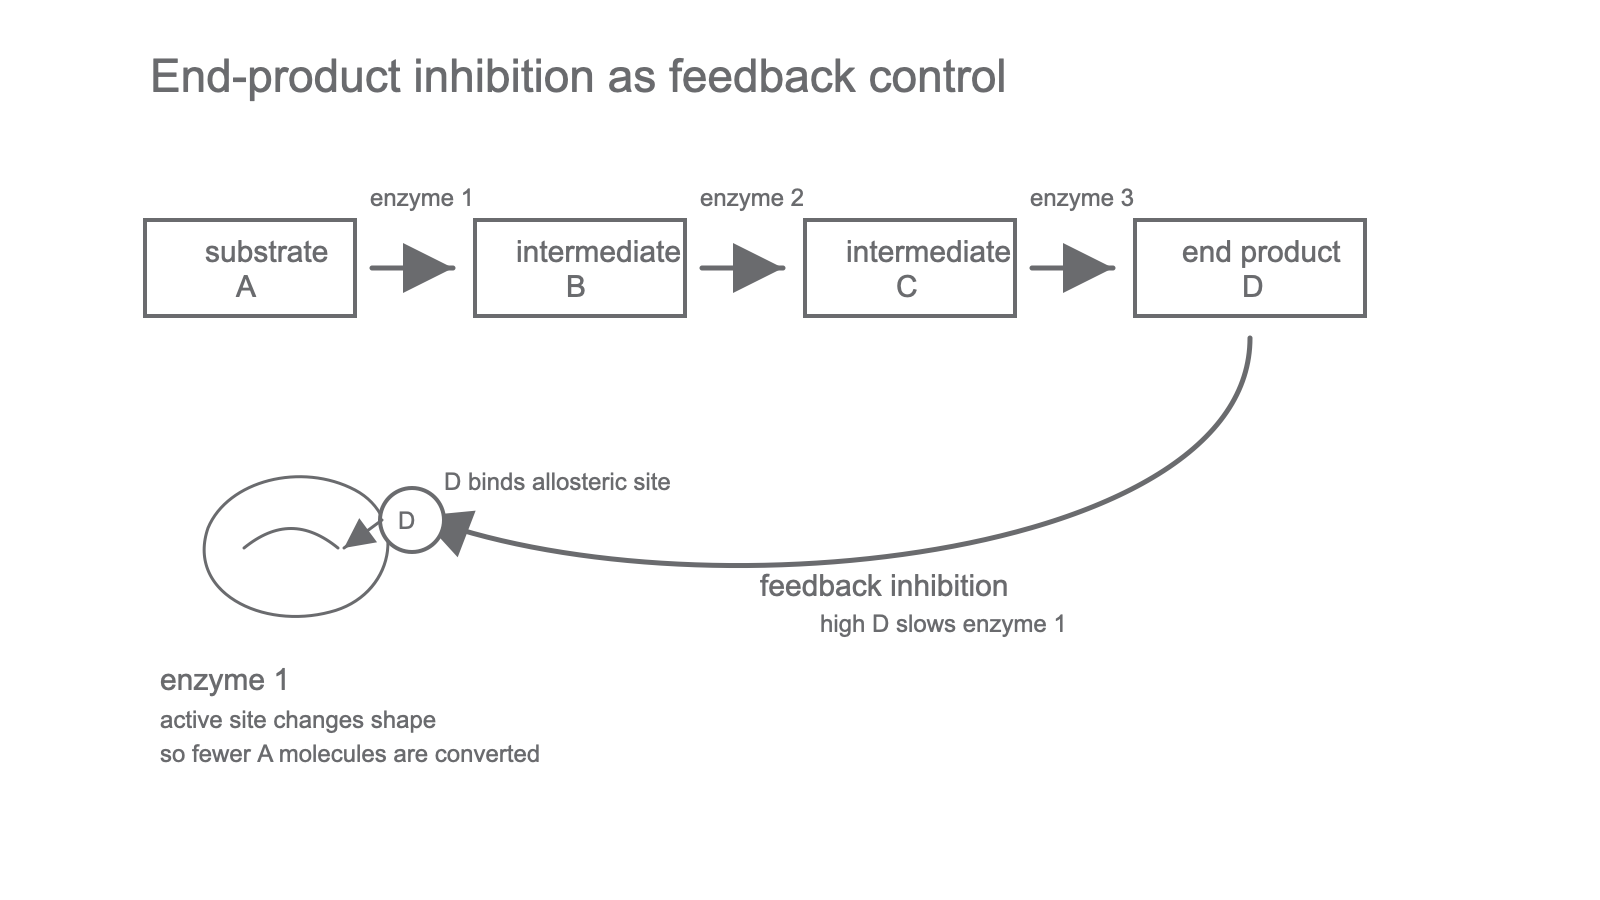
The usual OCR-level explanation is:
- A metabolic pathway produces an end product.
- When the end product concentration is high, the end product binds to an allosteric site on an enzyme near the start of the pathway.
- This changes the enzyme's shape, so fewer enzyme-substrate complexes form or catalysis is reduced.
- The pathway slows, so less end product is made.
- When end product concentration falls, inhibition is reduced and the pathway can speed up again.
This is useful because it prevents waste. The cell does not keep using substrate and energy to make a product that is already abundant.
PAG4 data decisions
In a PAG4-style inhibitor investigation, the core design decision is simple: change the inhibitor condition and measure the enzyme reaction rate. Everything else that affects enzyme activity should be controlled, especially enzyme concentration, substrate concentration, pH, temperature, total volume, incubation time, and the method used to measure product formation or substrate disappearance.
If inhibitor concentration is the independent variable, serial dilution can produce a sensible range. The dependent variable could be initial rate, such as volume of gas produced per second, decrease in absorbance per minute, or reciprocal time for a visible endpoint. Repeats allow a mean to be calculated and help identify anomalous results.
Data should be presented with clear headings and units. A line graph or scatter graph can show how rate changes with inhibitor concentration or substrate concentration. If rate is calculated from a curve, use the gradient at the relevant point; for a curve, a tangent may be needed.
Uncertainty belongs in the conclusion, not as an afterthought. If a rate uses volume and time, uncertainty in both measurements affects the calculated rate. For example, if 18.0 cm3 is measured with an uncertainty of +/-0.5 cm3 and 90 s is measured with an uncertainty of +/-1 s, an approximate percentage uncertainty is:
So a small difference between two rates may not be convincing if it is similar in size to the measurement uncertainty.
PAG4 data decisions Continued
Use the same method language in exam answers: one change is tested, the conditions are controlled, and the rate evidence is compared.
Inhibitor questions are usually solved by deciding where the inhibitor binds, whether adding more substrate can overcome the effect, whether enzyme activity can recover, and what the rate data actually show.