2.1.2(r) - Colorimetry for concentration determination
In this lesson you learn how a colorimeter can turn a colour change into a numerical estimate of concentration. The boundary is deliberately tight: the skill is using quantitative readings, known standards and a calibration curve to find the concentration of a chemical substance in solution. This is a PAG5-style practical/data lesson, so the emphasis is on method decisions, variables, graph use and valid conclusions.
From Colour To Concentration
A qualitative food test tells you whether a substance is present. Colorimetry goes further: it gives a numerical reading that can be linked to concentration. A colorimeter shines light of a selected wavelength through a solution and detects how much light is absorbed or transmitted.
Colorimetry
Colorimetry is a quantitative method that uses the absorbance or transmission of light by a solution to estimate the concentration of a chemical substance.
The key idea is simple. If the coloured substance absorbs light, a more concentrated solution usually absorbs more light, so its absorbance is higher. If the colorimeter is set to percentage transmission instead, a more concentrated solution usually lets less light through, so its transmission is lower.
OCR may use examples such as glucose after a colour reaction, protein after a Biuret-type colour reaction, or pigment released from beetroot tissue. The named biological context can change, but the method logic is the same:
- make or use solutions of known concentration;
- measure their colorimeter readings using the same conditions;
- plot a calibration curve;
- measure the unknown solution;
- use the curve to estimate the unknown concentration.
Colorimetry is quantitative because the conclusion comes from numerical readings and a calibration curve, not from judging colour by eye.
Making The Measurement Valid
A colorimeter reading is useful only if the measurement is controlled. A cuvette or test tube is placed in the light path. It should be clean, not scratched, and positioned consistently, because dirt, scratches and different light-path faces can change how much light reaches the detector.
The wavelength or filter should be suitable for the colour being measured. In practice, this means using the wavelength that gives a clear difference between samples. In OCR-style answers, "use an appropriate filter" is better than naming a filter without a reason.
The colorimeter must also be zeroed with a suitable blank. The blank contains everything that should not count as the measured substance. Sometimes this is distilled water. Sometimes it should include the solvent or reagent mixture without the substance being tested. The point of the blank is to remove background absorbance from the apparatus, solvent and reagents.
Blank
A blank is a reference sample used to zero the colorimeter so background absorbance from the solvent, reagents or cuvette is not counted as the test substance.
If a colour reaction is used before colorimetry, the reaction conditions must be controlled. For example, standard and unknown samples should use the same volume of sample, same volume and concentration of reagent, same heating or incubation time, same temperature, and the same time before readings are taken. Otherwise, a higher reading may be caused by a different method rather than a higher concentration.
| Method decision | Why it matters |
|---|---|
| Use the same cuvette orientation | Keeps the light path comparable between readings |
| Wipe cuvettes and remove bubbles | Prevents scattering or blocking light |
| Use the same wavelength or filter | Makes standards and unknowns comparable |
| Zero with a suitable blank | Reduces systematic error from background absorbance |
| Keep reaction time and temperature constant | Prevents method differences causing colour differences |
| Filter or centrifuge cloudy precipitate if it should not be measured | Prevents suspended solids affecting the light path |
Do not write only "calibrate the colorimeter". Be specific: zero it with a suitable blank, then use standards of known concentration to construct the calibration curve.
Standards And Calibration Curves
A standard solution has a known concentration. A set of standards is used to build the relationship between concentration and colorimeter reading. For a glucose investigation, the standards might be made by diluting a stock glucose solution to several known concentrations.
Concentration is normally plotted on the x-axis because it is the known independent variable for the standards. Absorbance or percentage transmission is plotted on the y-axis because it is the measured response.
[DIAGRAM: colorimetry_calibration_curve: Lesson 028: Colorimetry workflow and calibration curve - diagram 01; asset_slug: 028_m02_1_2_colorimetry_for_concentration_determination__diagram_01; recommended_method: drawn_biology; description: A clean 16:9 deterministic diagram showing known standards and an unknown sample being measured in a colorimeter, then a calibration graph with concentration on the x-axis, absorbance on the y-axis, a best-fit line through standards, and dashed interpolation from an unknown absorbance to its concentration.]
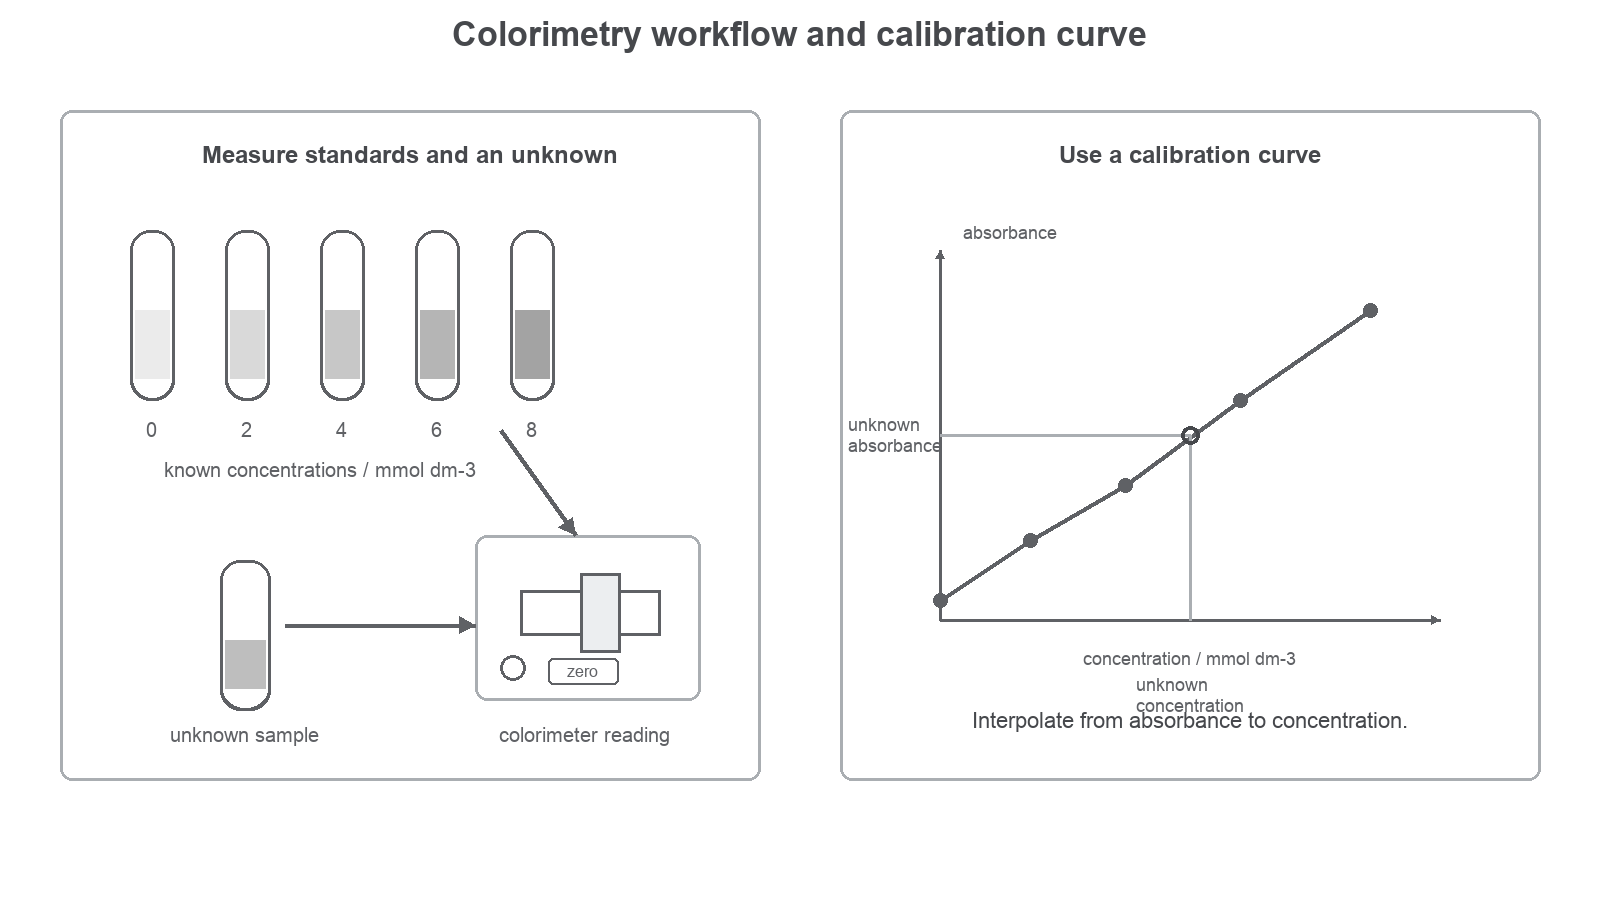
The unknown concentration should be read by interpolation, which means reading within the range of the standards. Extrapolation beyond the standards is weak because the relationship may stop being linear or may level off at high concentration.
Using A Calibration Curve
A student makes glucose standards and measures absorbance after the same colour reaction.
| Glucose concentration / mmol dm^-3 | Mean absorbance |
|---|---|
| 0 | 0.00 |
| 2 | 0.12 |
| 4 | 0.24 |
| 6 | 0.36 |
| 8 | 0.48 |
An unknown sample gives a mean absorbance of 0.30.
The standards show a straight-line pattern. The gradient is:
0.48 / 8 = 0.060 absorbance units per mmol dm^-3
Unknown concentration = 0.30 / 0.060 = 5.0 mmol dm^-3
The estimate is valid because 0.30 lies within the calibration range from 0.00 to 0.48 absorbance.
If the unknown gives a reading above the highest standard, do not just extend the line. Dilute the unknown by a known factor, measure the diluted sample, read the diluted concentration from the calibration curve, then multiply by the dilution factor to estimate the original concentration.
Variables Repeats And Quality
In a calibration-curve method, the independent variable for the standards is concentration. The dependent variable is the colorimeter reading. Control variables are the method features that must stay the same so the reading changes only because concentration changes.
For standards and unknowns, suitable control variables include:
- volume of sample;
- volume and concentration of reagent;
- heating or incubation time;
- temperature;
- wavelength or filter;
- cuvette type, path length and orientation;
- time between adding reagent and taking the reading.
Repeats improve reliability. For each standard, the student can take repeated readings and calculate a mean absorbance. If one reading is far from the others, it may be anomalous, but it should not be discarded without a reason. The student should repeat that concentration or check for practical causes such as a bubble, dirty cuvette, wrong dilution or poorly mixed sample.
Reliability
Reliability is the extent to which repeated measurements or repeated experiments give consistent results.
Validity
Validity is the extent to which the method measures what it is intended to measure.
A result can be reliable but not valid. For example, repeatedly using the wrong blank could give consistent readings, but all readings could include background absorbance from the reagent. That would be a systematic error.
The calibration range matters too. If the unknown reading is below the lowest standard or above the highest standard, the concentration estimate is less valid. A better method would make a new set of standards covering the unknown or dilute the unknown until its reading falls inside the existing range.
Exam-Style Reasoning
Colorimetry questions often reward a sequence, not just a single fact. A strong method answer usually includes the standards, the colorimeter setup, the graph and the unknown sample.
For example, if asked how to determine the concentration of protein in an unknown solution using a colorimeter, a complete route would be:
- prepare or use several protein solutions of known concentration;
- treat each standard and the unknown with the same colour-producing reagent under the same conditions;
- zero the colorimeter with a suitable blank;
- choose an appropriate wavelength or filter;
- measure absorbance or transmission for each standard;
- plot a calibration curve;
- measure the unknown;
- read the unknown concentration from the curve.
Command words change the answer shape. "Describe" needs the method sequence. "Explain" needs reasons, such as why a blank is used or why conditions are controlled. "Use the data" needs values from a table or graph. "Evaluate" needs limits, such as extrapolation, lack of repeats, or uncontrolled reaction conditions.