2.1.4(d)(i)-(ii) - Factors affecting enzyme activity and enzyme practicals
Enzyme activity means the rate of an enzyme-controlled reaction under a stated set of conditions. In this lesson you will learn how temperature, pH, enzyme concentration and substrate concentration change enzyme activity, how to calculate Q10, and how to design and interpret PAG4-style enzyme-rate investigations. The central idea is simple: every explanation must connect the factor being changed to enzyme-substrate complex formation, product formation and measured rate.
Activity as rate
An enzyme is active when it converts substrate into product. In experiments, enzyme activity is measured as a rate: product formed per unit time, substrate used per unit time, or the reciprocal of the time taken for an endpoint to be reached.
Enzyme activity
Enzyme activity is the rate at which an enzyme-controlled reaction occurs under specified conditions.
Reaction rate
The method determines the rate unit. A catalase investigation might measure oxygen volume in cm3 s-1. An amylase investigation might record the time taken until starch no longer gives a blue-black colour with iodine, then use 1 / time as a relative rate. A colorimeter or pH probe could collect continuous readings, which can later be processed with software.
The first OCR skill is to state the rate clearly. The second is to remember that a low rate is not the same as "no enzyme". The active site may still exist, but fewer successful enzyme-substrate complexes are forming per second.
Calculating an enzyme rate
A catalase reaction produces 18.0 cm3 of oxygen in the first 90 s.
The calculated rate should use sensible significant figures and a unit that matches the measured quantities.
Now practise the same rate idea with a new set of values.
Temperature and pH
Temperature affects enzyme activity in two linked ways. As temperature rises at first, substrate and enzyme molecules have more kinetic energy. They collide more often and more collisions have enough energy to form enzyme-substrate complexes, so rate increases.
Above the optimum temperature, the enzyme's tertiary structure is disrupted. Bonds such as hydrogen bonds and ionic bonds that help maintain the active site's shape can break. The active site changes shape, so the substrate is no longer complementary and fewer enzyme-substrate complexes form. This is denaturation.
Optimum temperature
The temperature at which an enzyme has its highest activity under the stated experimental conditions.
Low temperature does not usually denature the enzyme. It lowers kinetic energy and reduces collision frequency. If the enzyme is warmed again without being damaged, activity can increase again.
pH affects enzyme activity because pH changes the concentration of hydrogen ions. These can alter the charges on R groups in the enzyme and disrupt bonds involved in tertiary structure. Each enzyme has an optimum pH range. Away from that optimum, the active site may be less complementary to the substrate. At extreme pH values, the enzyme may denature.
[DIAGRAM: enzyme_activity_factor_curves: Lesson 38: Factors affecting enzyme activity and enzyme practicals - diagram 01; asset_slug: 038_m02_1_4_factors_affecting_enzyme_activity_and_enzyme_practicals__diagram_01; recommended_method: matplotlib; description: 16:9 four-panel line-graph visual showing rate against temperature, pH, enzyme concentration and substrate concentration, with qualitative OCR-safe curves and all axes in NovaLearn grey styling.]
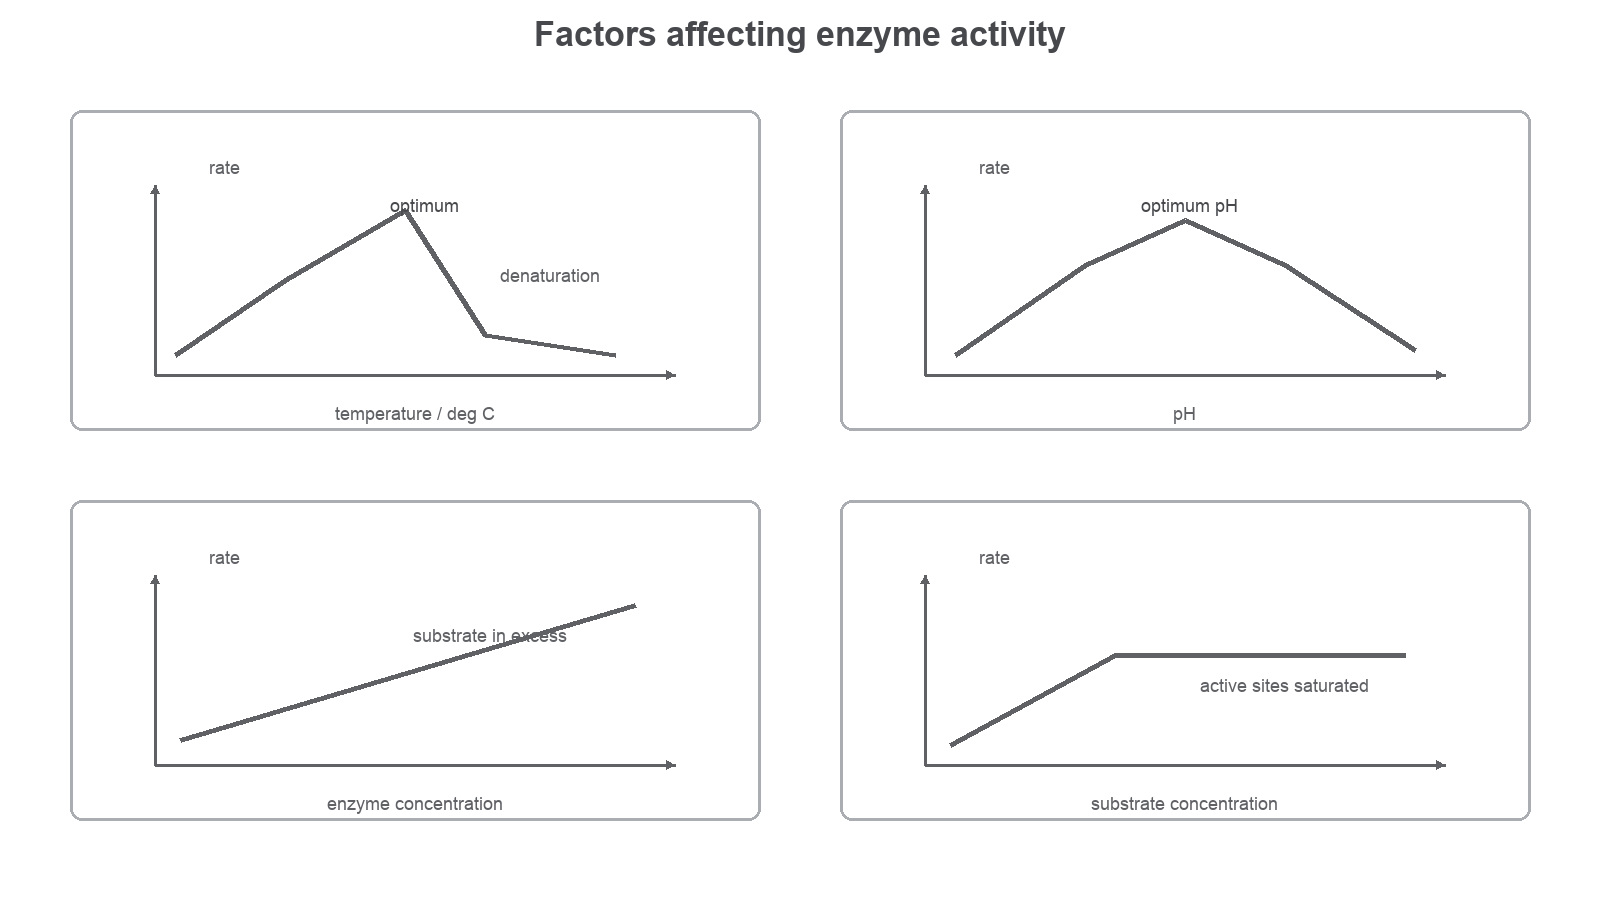
Use the diagram as a map of graph shapes, not as a set of universal numbers. Different enzymes have different optimum temperatures and pH values. OCR rewards the explanation: temperature and pH change enzyme activity because they affect kinetic energy, tertiary structure, active-site shape, enzyme-substrate complex formation and product formation.
Do not write that low temperature denatures enzymes. For low temperature, explain fewer successful collisions. For high temperature or extreme pH, explain disruption of tertiary structure and active-site shape.
Concentration effects
Enzyme concentration and substrate concentration affect rate by changing how often enzyme and substrate can meet.
If substrate is in excess, increasing enzyme concentration increases rate. There are more enzyme molecules and therefore more active sites available, so more enzyme-substrate complexes can form per second. In this region, rate is often approximately proportional to enzyme concentration.
If substrate becomes limiting, adding more enzyme will not keep increasing rate at the same pace because there are not enough substrate molecules to occupy the extra active sites. The factor in shortest effective supply limits the rate.
Substrate concentration has a different curve. At low substrate concentration, increasing substrate concentration increases rate because substrate molecules collide with active sites more often. At high substrate concentration, most active sites are occupied most of the time. The active sites are saturated, so increasing substrate concentration has little further effect unless more active enzyme is added.
| Factor increased | Usual rate effect | OCR-safe explanation |
|---|---|---|
| Enzyme concentration, with substrate in excess | Rate increases | More active sites are available. |
| Enzyme concentration, with little substrate | Increase becomes limited | Substrate becomes the limiting factor. |
| Substrate concentration, at low substrate concentration | Rate increases | More frequent collisions with active sites. |
| Substrate concentration, at high substrate concentration | Rate plateaus | Active sites are saturated; enzyme concentration is limiting. |
Do not use Michaelis-Menten constants or Lineweaver-Burk plots here. For this OCR row, the important skill is to explain the qualitative graph shape and to identify which factor is limiting.
Q10 from rate data
Q10 is the temperature coefficient. It compares the rate of a reaction at two temperatures that are 10 degrees C apart.
Temperature coefficient
In this formula, R1 is the rate at the lower temperature and R2 is the rate at the temperature 10 degrees C higher. If the rate doubles over a 10 degrees C increase, Q10 is 2.0. Do not assume Q10 is always 2.0; calculate it from the data.
If the raw data are endpoint times, convert time to rate before calculating Q10. A shorter time means a faster reaction, so using the time values directly would reverse the result.
Calculating Q10 from endpoint times
An amylase reaction is timed at two temperatures.
| Temperature / degrees C | Time for starch to disappear / s | Relative rate / s-1 |
|---|---|---|
| 20 | 80 | 1 / 80 = 0.0125 |
| 30 | 40 | 1 / 40 = 0.0250 |
The temperatures are 10 degrees C apart, so:
The rate doubled between 20 degrees C and 30 degrees C under these conditions.
[DIAGRAM: q10_rate_data_graph: Lesson 38: Factors affecting enzyme activity and enzyme practicals - diagram 02; asset_slug: 038_m02_1_4_factors_affecting_enzyme_activity_and_enzyme_practicals__diagram_02; recommended_method: matplotlib; description: 16:9 plotted enzyme-rate data graph with axes, highlighted rates at temperatures 10 degrees C apart, and a Q10 = R2/R1 annotation in NovaLearn grey styling.]
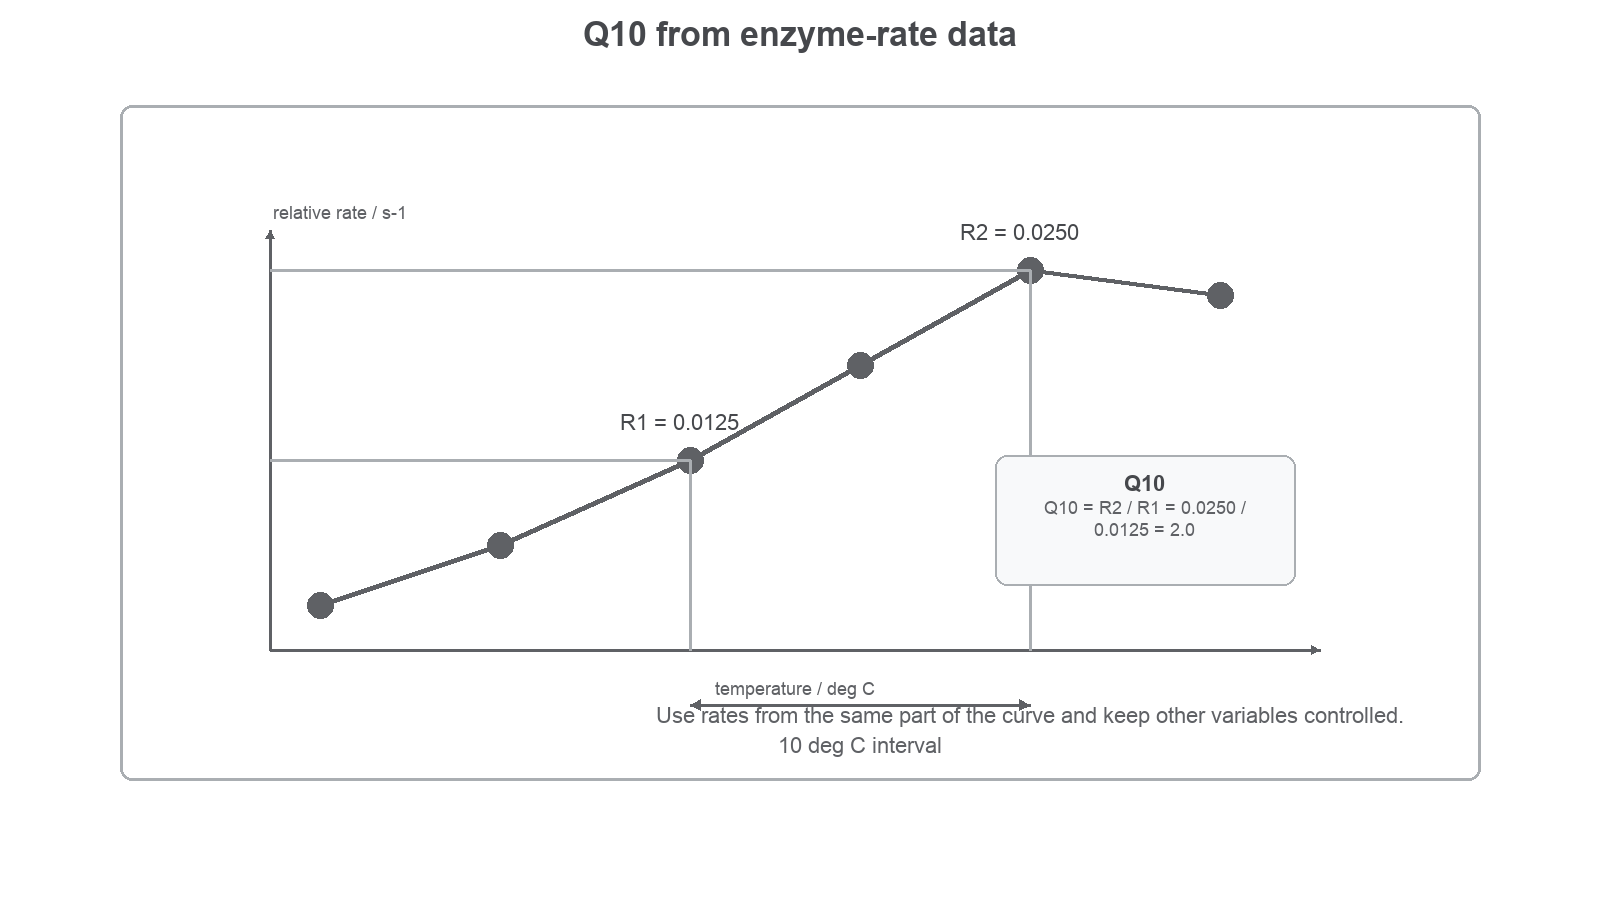
Near the optimum temperature, Q10 may stop following a simple rise because denaturation begins to reduce the number of active enzyme molecules. That is why a Q10 calculation must be interpreted in context rather than treated as a rule that rate always doubles.
PAG4 method decisions
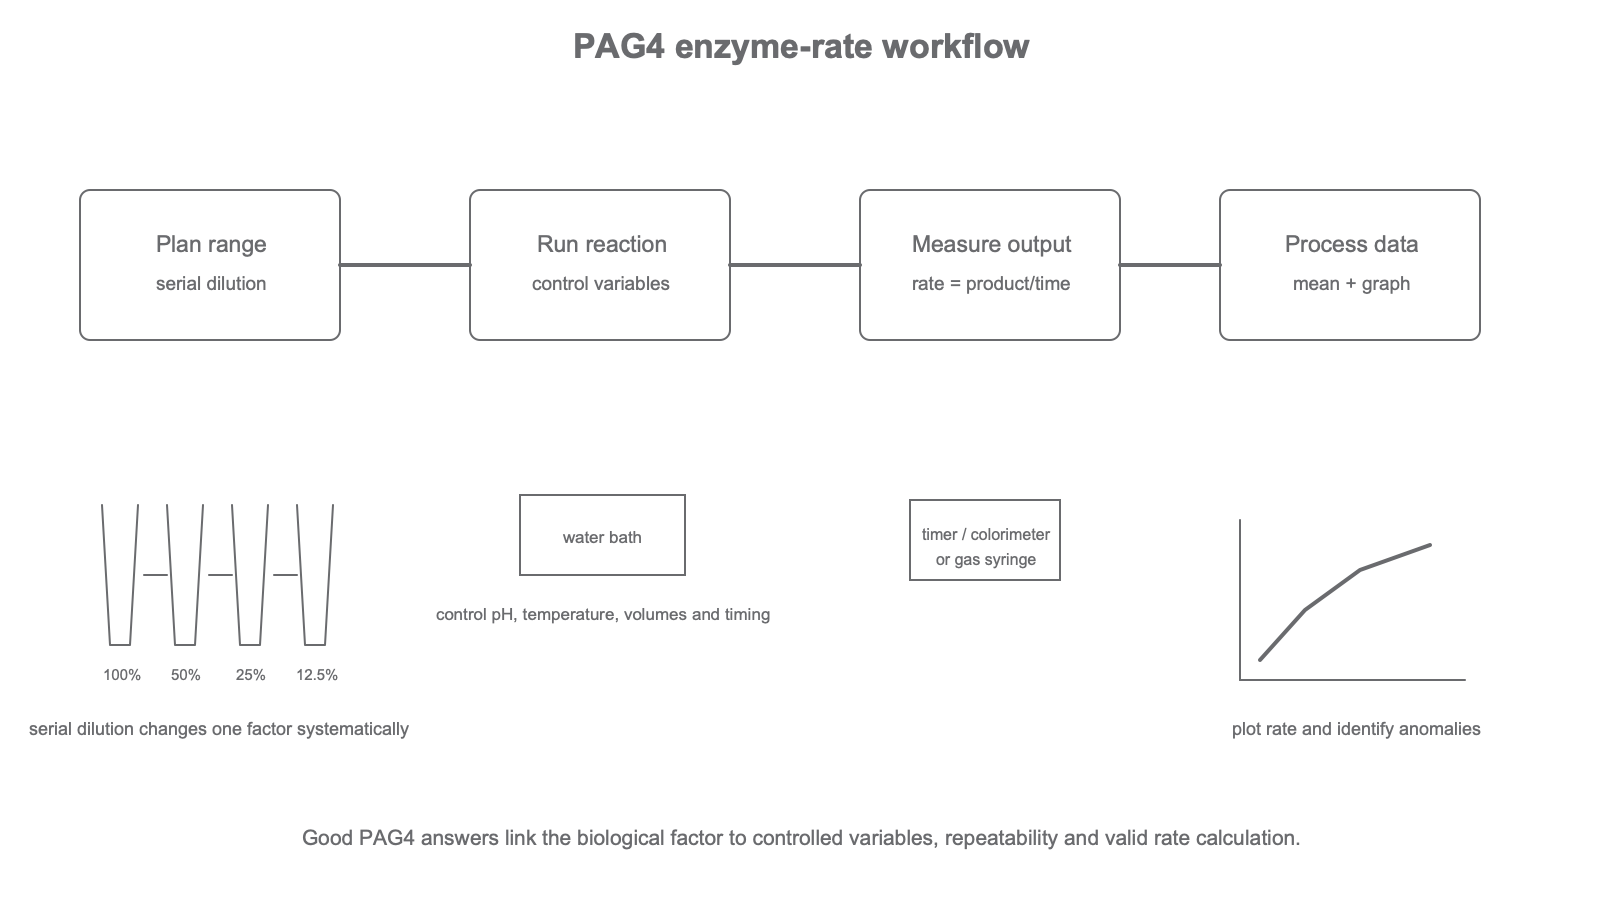
PAG4 is about measuring the rate of enzyme-controlled reactions. The same design logic works whether the independent variable is pH, temperature, enzyme concentration or substrate concentration.
- Choose one independent variable to change.
- Keep the other rate-affecting variables constant.
- Measure a dependent variable that can be converted into rate.
- Repeat and calculate a mean, checking for anomalies.
- Present the data with clear headings, units and graph axes.
For a temperature investigation, use water baths and allow solutions to reach the chosen temperature before mixing enzyme and substrate. For a pH investigation, use buffer solutions. For an enzyme- or substrate-concentration investigation, use a dilution series so the concentrations are planned rather than guessed.
[DIAGRAM: pag4_serial_dilution_workflow: Lesson 38: Factors affecting enzyme activity and enzyme practicals - diagram 03; asset_slug: 038_m02_1_4_factors_affecting_enzyme_activity_and_enzyme_practicals__diagram_03; recommended_method: drawn_biology; description: 16:9 deterministic practical workflow showing serial dilution tubes leading to an enzyme-rate reaction setup, controlled variables, measured rate output and graphing step in NovaLearn grey styling.]
Planning a two-fold serial dilution
A student starts with a 100% enzyme stock solution.
- Tube A contains 10.0 cm3 of stock: 100%.
- Transfer 5.0 cm3 from tube A into 5.0 cm3 of distilled water: 50%.
- Transfer 5.0 cm3 from the 50% tube into 5.0 cm3 of distilled water: 25%.
- Transfer 5.0 cm3 from the 25% tube into 5.0 cm3 of distilled water: 12.5%.
Each step halves the concentration because equal volumes of solution and water are mixed. In the final reaction mixture, the total volume must still be controlled, otherwise volume itself becomes a confounding variable.
Suitable rate measurements include oxygen volume from catalase and hydrogen peroxide, time for starch to disappear in an amylase-iodine test, pH change when lipase produces fatty acids, or absorbance change with a colorimeter. Safety points depend on the method, but common PAG4 answers include wearing eye protection, handling hot water baths carefully, treating enzymes/iodine/hydrogen peroxide according to hazard information, and cleaning spills quickly.
Data and conclusions
A strong conclusion uses the data first, then the biology. Start by describing the trend with figures. Then explain the trend using active sites, enzyme-substrate complexes, denaturation or limiting factors, depending on the independent variable.
| Substrate concentration / arbitrary units | Mean rate / cm3 s-1 |
|---|---|
| 10 | 0.16 |
| 20 | 0.30 |
| 30 | 0.42 |
| 40 | 0.47 |
| 50 | 0.48 |
For these data, rate increases steeply from 0.16 to 0.42 cm3 s-1 as substrate concentration increases from 10 to 30 arbitrary units. Then the increase becomes much smaller, from 0.47 to 0.48 cm3 s-1 between 40 and 50 arbitrary units. The biological explanation is that substrate concentration increases the frequency of collisions with active sites at first, but at high substrate concentration the active sites are saturated and enzyme concentration is limiting.
Graph decisions matter. Put the independent variable on the x-axis and rate on the y-axis, with units in the headings. If product formed is plotted against time, the initial rate is the gradient near the start of the curve. If the curve is not straight at the point being measured, a tangent may be needed.
Uncertainty and limitations belong in the interpretation. Stopwatch timing can be limited by human reaction time. Gas volumes can be affected if gas escapes or dissolves in water. Endpoint colour changes can be subjective. Repeats, means and anomaly checks make the conclusion more reliable, but they do not fix an invalid design where a second variable has changed.
Data and conclusions Summary
For OCR enzyme-rate questions, name the factor, describe the rate change, explain it through active sites and enzyme-substrate complexes, then use practical data carefully with units, repeats, uncertainty and controlled variables.
Explain It Back
Use this as a self-explanation check after the section above. It is for diagnosing what you can already explain, not for learning new material from scratch.