4.2.3.2b - Translocation and Plant Transport Data
Plants need a transport system because roots, stems and leaves do different jobs in different places. This lesson focuses on phloem and translocation, then on the data skills used when plant transport is investigated. Keep the two transport tissues separate: xylem is the water and mineral ion route, while phloem is the dissolved sugar route.
Plant transport jobs
The roots, stem and leaves form a plant organ system for transport. A plant organ system is a group of organs working together; here, the system moves substances between roots, stems and leaves.
The two transport tissues you must keep distinct are xylem and phloem.
| Tissue | Main substance transported | Main GCSE description |
|---|---|---|
| Xylem | Water and mineral ions | From roots to stems and leaves in the transpiration stream |
| Phloem | Dissolved sugars | From leaves to the rest of the plant for immediate use or storage |
This lesson does not retell all the xylem adaptations from earlier plant transport work. The key retrieval is that xylem is not used for dissolved sugars. Dissolved sugars move in phloem.
Translocation
Translocation is the movement of food molecules through phloem tissue.
In this part of the course, the food molecules to name are dissolved sugars. They are made in leaves during photosynthesis and then moved to other parts of the plant where they can be used immediately or stored.
Translocation in phloem
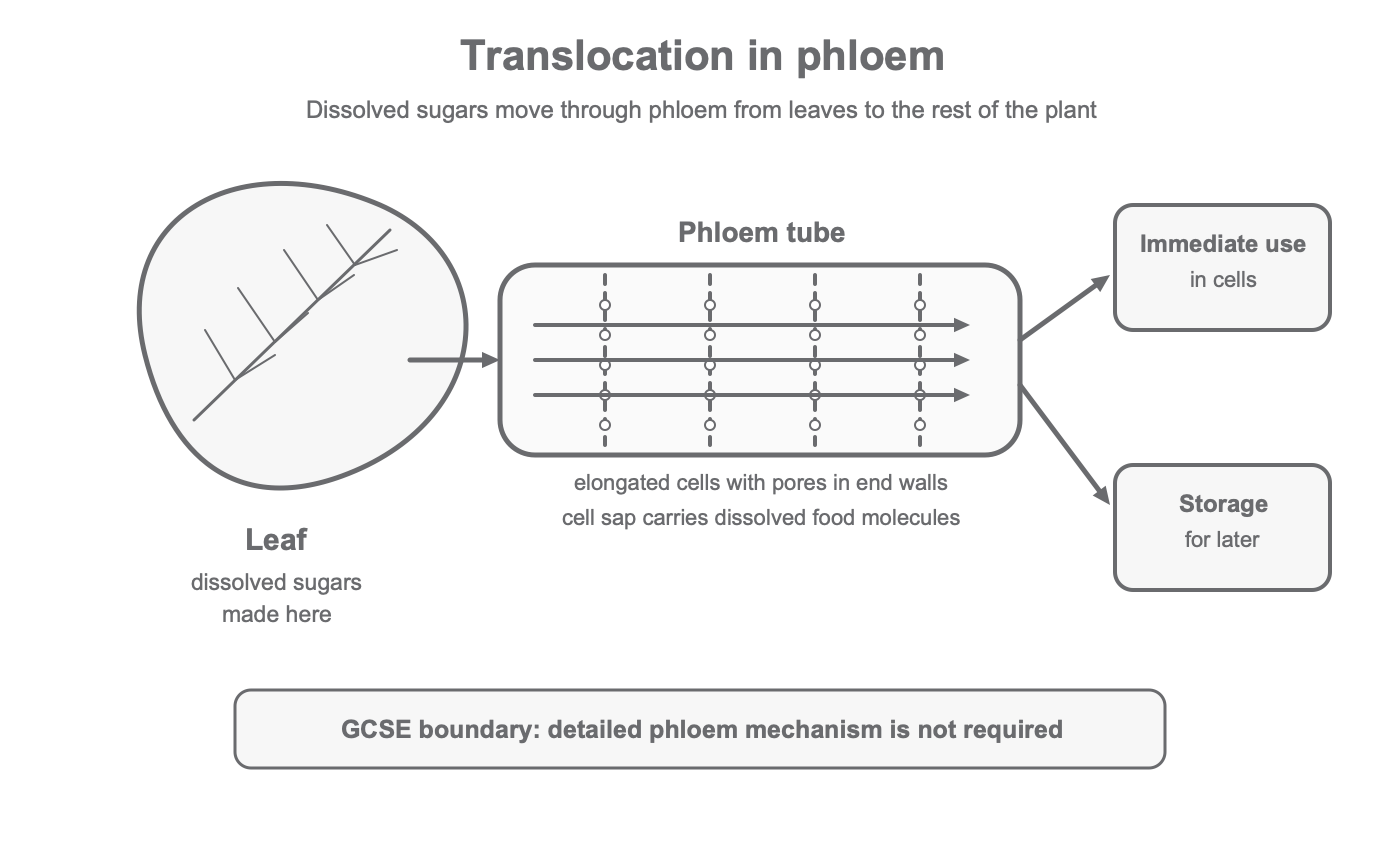
Phloem tissue transports dissolved sugars from the leaves to the rest of the plant. Those sugars may be used straight away in respiration, growth and other cell processes, or stored for later use.
Phloem is made of tubes of elongated cells. The end walls have pores, so cell sap can move from one phloem cell to the next.
Cell sap
Cell sap is the solution inside plant cells. In phloem, it contains dissolved food molecules such as dissolved sugars.
For this course, the stopping point is clear: detailed structure of phloem tissue and the detailed mechanism of transport are not required here. That means you do not need extra mechanism explanations or detailed named phloem cell types for this lesson unless a question gives you extra information.
[DIAGRAM: asset_name: phloem_translocation_schematic - diagram 1; asset_slug: 029_4_2_3_2b_translocation_and_plant_transport_data_diagram1; file: diagram_assets/imagegen_regen_all/029_4_2_3_2b_translocation_and_plant_transport_data_diagram1_imagegen.png; recommended_method: codex_image_gen; description: Monochrome deterministic schematic of translocation in phloem. Show a leaf labelled dissolved sugars made in leaves, a phloem tube made of elongated cells with pores in end walls, arrows showing cell sap moving through phloem to the rest of the plant, and destination labels immediate use and storage. Include a small note: detailed mechanism not required. Do not show extra phloem cell types, transport mechanism steps or coloured tissue anatomy.]
Rates and means
Plant transport data often uses a rate. A rate is a compound measure because it combines a change with the time taken for that change.
Rate
For plant transport, the change might be the distance an air bubble moves in a tube, the volume of water taken up, or the mass of water lost. The unit must match the data. For example, if distance is measured in millimetres and time in minutes, the rate is in mm/min.
Worked example:
A plant shoot takes up enough water to move an air bubble 24 mm in 8 min.
- Write the relationship:
rate = change / time - Substitute:
rate = 24 mm / 8 min - Calculate:
rate = 3 mm/min
If repeats are given, use the arithmetic mean unless an anomalous result should be excluded. Add the repeat values, then divide by the number of repeat values used.
Worked example:
The repeated rates are 2.8 mm/min, 3.1 mm/min and 3.0 mm/min.
mean = (2.8 + 3.1 + 3.0) / 3 = 2.97 mm/min
To a sensible precision, this is about 3.0 mm/min.
Environmental effects
Transpiration is the loss of water vapour from the leaves. It is not the same process as translocation, but transpiration data is often used in plant transport questions. The role of stomata and guard cells is to control gas exchange and water loss.
Stomata
Stomata are tiny pores, mostly in leaves, that allow gas exchange and water vapour loss.
Guard cells open and close stomata. When stomata are more open, carbon dioxide can enter for photosynthesis, but more water vapour can also leave.
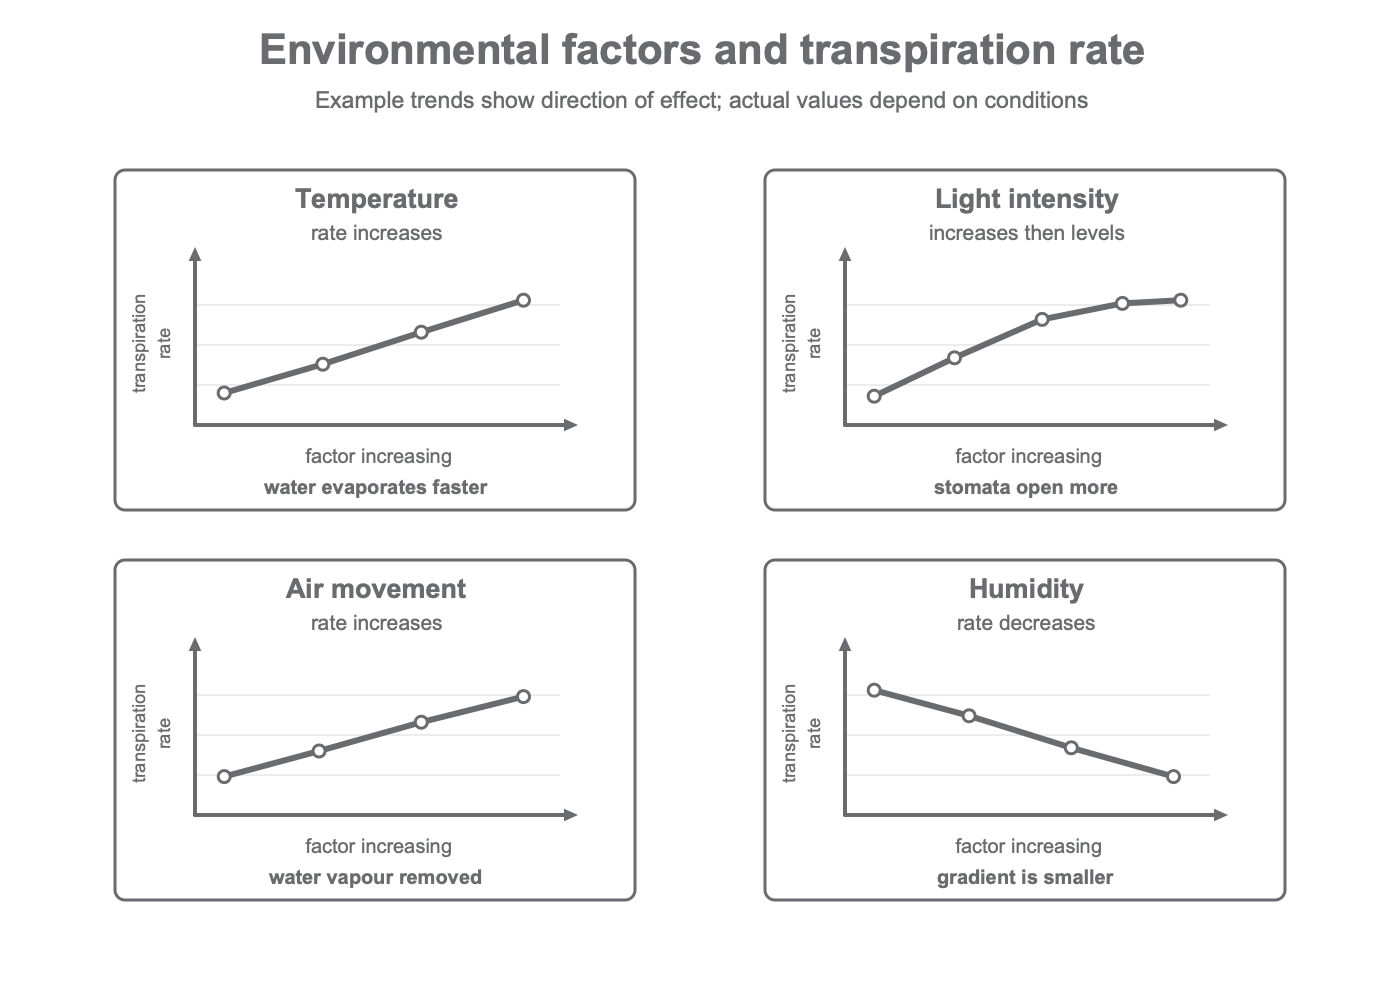
The four environmental factors named in this specification point affect transpiration rate in predictable ways:
| Factor increased | Usual effect on transpiration rate | Why |
|---|---|---|
| Temperature | Increases | Water evaporates and diffuses faster |
| Humidity | Decreases | The water vapour concentration gradient out of the leaf is smaller |
| Air movement | Increases | Moving air removes water vapour from around the leaf |
| Light intensity | Increases | Stomata usually open more for gas exchange during photosynthesis |
Very high or unusual conditions may produce different patterns if the plant closes its stomata or another factor becomes limiting. In GCSE data questions, use the trend in the table or graph you are given, then explain it with the named factor.
[DIAGRAM: asset_name: environmental_factor_graphs - diagram 2; asset_slug: 029_4_2_3_2b_translocation_and_plant_transport_data_diagram2; file: diagram_assets/029_4_2_3_2b_translocation_and_plant_transport_data_diagram2.png; recommended_method: deterministic_drawn; description: Monochrome deterministic 2x2 panel of simple graph trends for transpiration rate. Panels show increasing temperature increasing rate, increasing light intensity increasing rate then levelling, increasing air movement increasing rate, and increasing humidity decreasing rate. Use labelled axes, neutral linework, and a note that example trends show direction, not universal values.]
Use that same gradient idea when you explain data from windy or still conditions.
Sampling and data skills
Plant transport investigations do not always measure a whole plant or a whole leaf. Sampling means collecting data from a smaller part, then using it to estimate a wider pattern.
In stomata investigations, a student may count stomata in several equal-sized areas of a leaf surface or epidermis impression. A good sampling method should be representative, unbiased, comparable and repeated:
- Representative: use several areas or leaves, not just one place on one leaf.
- Unbiased: choose positions randomly or by a planned grid before looking at the counts.
- Comparable: count the same area each time, such as the same field of view or
1 mm2, using the same method. - Repeated: calculate a mean and consider whether any result is anomalous.
In transpiration investigations, the same idea applies to rates. If data is collected from different shoots or repeated trials, compare the mean rates and check that only the intended factor has changed.
Surface area and volume calculations appear when plant transport data has been scaled to the size of a leaf, a sample area or a tube.
For surface area:
- A simple rectangular area is
length x width. - Stomatal density can be calculated as
number of stomata / area sampled. - Water loss or water uptake may be compared per
cm2of leaf area if leaves are different sizes.
For volume:
- In a capillary tube,
volume moved = cross-sectional area x distance moved. - If the radius of a circular tube is given,
cross-sectional area = pi r^2. - Keep units consistent. For example,
mm2 x mm = mm3.
Worked examples:
An exam may simplify a leaf as a rectangle with length 6 cm and width 4 cm.
surface area = length x width = 6 cm x 4 cm = 24 cm2
If water loss is then compared per cm2, this makes leaves of different sizes easier to compare fairly.
A student counts 36 stomata in an area of 2 mm2.
stomatal density = 36 / 2 = 18 stomata per mm2
An air bubble moves 25 mm along a tube with cross-sectional area 0.04 mm2.
volume moved = 0.04 mm2 x 25 mm = 1.0 mm3
Graph skills are part of the same data work. A sensible graph scale should cover the full range of the data, use most of the axis, and have easy intervals such as 1, 2, 5 or 10 and their decimal multiples. If all transpiration rates are between 0.02 and 0.06 cm3/min, a y-axis from 0 to 0.06 in 0.01 intervals is more useful than a y-axis from 0 to 1.0 in 0.1 intervals.
You can also make a graph-style conclusion from a table without drawing the graph. Read the independent variable in order, describe whether the dependent variable increases, decreases, stays the same or levels off, and quote data values to support the pattern. If the values rise and then stop rising, say that the trend levels off rather than saying it keeps increasing.
Sampling checks use the same rule: use the numbers given, then explain why the data collection method is fair.
The next step is to combine these skills with ordinary tables and written conclusions.
Reading transport data
Plant transport questions often ask you to move between a table, a graph and a written conclusion. The safest routine is:
- Identify the independent variable, which is the factor changed.
- Identify the dependent variable, which is the measurement taken.
- Check the units before calculating.
- Quote data when describing a trend.
- Link the trend to the biology of stomata, transpiration or phloem transport.
For graphs, the independent variable usually goes on the x-axis and the dependent variable on the y-axis. A continuous variable such as temperature or light intensity usually suits a line graph. Categories such as "still air" and "moving air" usually suit a bar chart.
Worked example:
| Temperature in degrees C | Water uptake in 10 min in cm3 |
|---|---|
| 15 | 0.20 |
| 25 | 0.36 |
| 35 | 0.52 |
Describe the trend and calculate the rate of water uptake at 35 degrees C.
The water uptake increases as temperature increases. It rises from 0.20 cm3 in 10 min at 15 degrees C to 0.52 cm3 in 10 min at 35 degrees C.
rate = 0.52 cm3 / 10 min = 0.052 cm3/min
The biological explanation is that higher temperature makes evaporation and diffusion of water vapour faster, so transpiration rate and water uptake increase.
For plant transport data, do not only say "it goes up" or "it goes down". Quote the data, calculate rates when needed, and connect the pattern to the plant transport process.
Now compare two conditions using both the numbers and the biology.