4.2.2.6 - Lifestyle Risk Factors and Non-Communicable Disease
Non-communicable diseases are not passed from person to person, but their incidence can still change between groups of people. In this lesson, you will link lifestyle risk factors to some non-communicable diseases, then practise the data language AQA expects: sampling, correlation, graphs and numerical comparisons. The careful idea is that a risk factor increases the rate of a disease; it does not automatically prove that the factor caused every case.
Risk factors and incidence
A risk factor is something linked to an increased rate of a disease. In this topic, the disease examples are non-communicable diseases, so they are not spread by pathogens from one person to another.
Risk factor
Something associated with an increased rate or chance of a disease.
AQA names two broad types of risk factor. Some are aspects of a person's lifestyle, such as diet, alcohol use, smoking and exercise level. Others are substances in the person's body or environment, such as carcinogens or ionising radiation.
Incidence
The number of new cases of a disease in a population during a particular time.
When scientists compare risk factors with disease incidence, they are looking for patterns in groups. For example, one town might have a higher percentage of smokers and a higher incidence of lung disease than another town. That pattern matters, but it is only the start of the reasoning.
The same idea can be studied at different scales. A local study might compare areas within one city, a national study might compare regions in one country, and a global study might compare countries. At every scale, the question is whether lifestyle factors are linked to differences in disease incidence.
A causal mechanism is a proven biological explanation for how one factor produces an effect. For some risk factors, a causal mechanism has been shown. For others, data may show a correlation without proving cause. A good GCSE answer keeps those ideas separate.
Named lifestyle links
AQA expects you to know named links between lifestyle factors and some non-communicable diseases. You do not need to memorise every detailed medical pathway, but you do need accurate cause-and-effect language.
Diet, smoking and exercise can affect the risk of cardiovascular disease. A diet high in saturated fat can increase blood cholesterol, which increases the risk of fatty deposits in blood vessels. Smoking damages the circulatory system and can increase blood pressure. Regular exercise reduces the risk of cardiovascular disease by helping to keep the heart and blood vessels healthy.
Obesity is a risk factor for Type 2 diabetes. This does not mean every person with obesity will develop Type 2 diabetes, and it does not mean every person with Type 2 diabetes has obesity. It means obesity is linked to an increased incidence of Type 2 diabetes in population data.
Alcohol can affect both the liver and brain function. Long-term heavy alcohol use can damage liver cells and lead to liver disease. Alcohol also affects brain function, so it can change judgement, coordination and reaction time.
Smoking increases the risk of lung disease and lung cancer. Tobacco smoke contains harmful substances, including carcinogens. A carcinogen is a substance or agent that increases the risk of cancer.
The effects of smoking and alcohol can also harm unborn babies. Smoking during pregnancy can reduce the oxygen reaching the fetus and is linked to increased risk of low birth weight and other problems. Alcohol during pregnancy can affect development of the unborn baby, including brain development.
Carcinogens, including ionising radiation, are risk factors for cancer. Ionising radiation can damage DNA in cells, increasing the risk that cell division becomes abnormal. Many diseases are caused by the interaction of several factors, so a single risk factor rarely explains the whole pattern on its own.
Human and financial costs
Non-communicable diseases can have a human cost. For an individual, this may include pain, anxiety, reduced mobility, reduced quality of life or premature death. For families and local communities, it may include caring responsibilities and reduced participation in school, work or community life.
There is also a financial cost. At an individual level, illness may reduce income or increase the cost of care. At a local or national level, healthcare services spend money on appointments, tests, medicines, operations, rehabilitation and long-term support. Globally, non-communicable diseases can reduce the number of people able to work and can increase the cost of public health programmes.
AQA can ask about costs at different scales: individual, local community, nation or globally. The safe answer is to name the scale and then give a specific cost, rather than making a vague statement such as "it is bad for people".
Sampling and risk data
Risk-factor evidence usually comes from studying samples of people. A sample is a group selected from a larger population. A larger sample is usually more reliable than a very small sample because one unusual person has less effect on the overall result.
The sample also needs to be representative. If a study only uses people from one age group, one occupation or one area, the result may not apply fairly to the whole population. Scientists also look for confounding variables: other factors that might affect the disease rate. For example, if one group smokes more but is also much older, age could affect the disease incidence as well as smoking.
Good interpretation of risk data asks:
| Data question | Why it matters |
|---|---|
| How large is the sample? | Small samples are more affected by chance. |
| Is the sample representative? | Biased samples may not match the wider population. |
| Are the same units used? | Incidence rates must be compared fairly. |
| Are other factors controlled or considered? | A different factor may explain some of the pattern. |
| Is there a biological mechanism? | A mechanism makes a causal explanation stronger. |
Worked example:
A study compares new cases of Type 2 diabetes in two groups of 10,000 adults over one year.
| Group | Percentage with obesity | New Type 2 diabetes cases per year |
|---|---|---|
| A | 18% | 62 |
| B | 34% | 128 |
Group B has both a higher percentage with obesity and more new cases of Type 2 diabetes. The incidence in group B is about twice that in group A because 128 / 62 = 2.06. This supports a link between obesity and Type 2 diabetes incidence, but a careful conclusion would still ask whether the groups were similar in age, diet, exercise level and family history.
Scatter diagrams and correlation
A scatter diagram shows paired data. In this topic, one variable is usually a possible risk factor and the other is disease incidence. Each point represents one person, group or area.
[DIAGRAM: asset_name: smoking-exposure-correlation - diagram 1; asset_slug: 025_4_2_2_6_lifestyle_risk_factors_and_non_communicable_disease_diagram1; file: diagram_assets/025_4_2_2_6_lifestyle_risk_factors_and_non_communicable_disease_diagram1.png; recommended_method: deterministic_drawn; description: Monochrome scatter diagram using simplified teaching data. The x-axis is smoking exposure index and the y-axis is new lung disease cases per 1000 people per year. Points form a positive correlation with a labelled line of best fit. A short note states that correlation supports a link but does not by itself prove causation.]
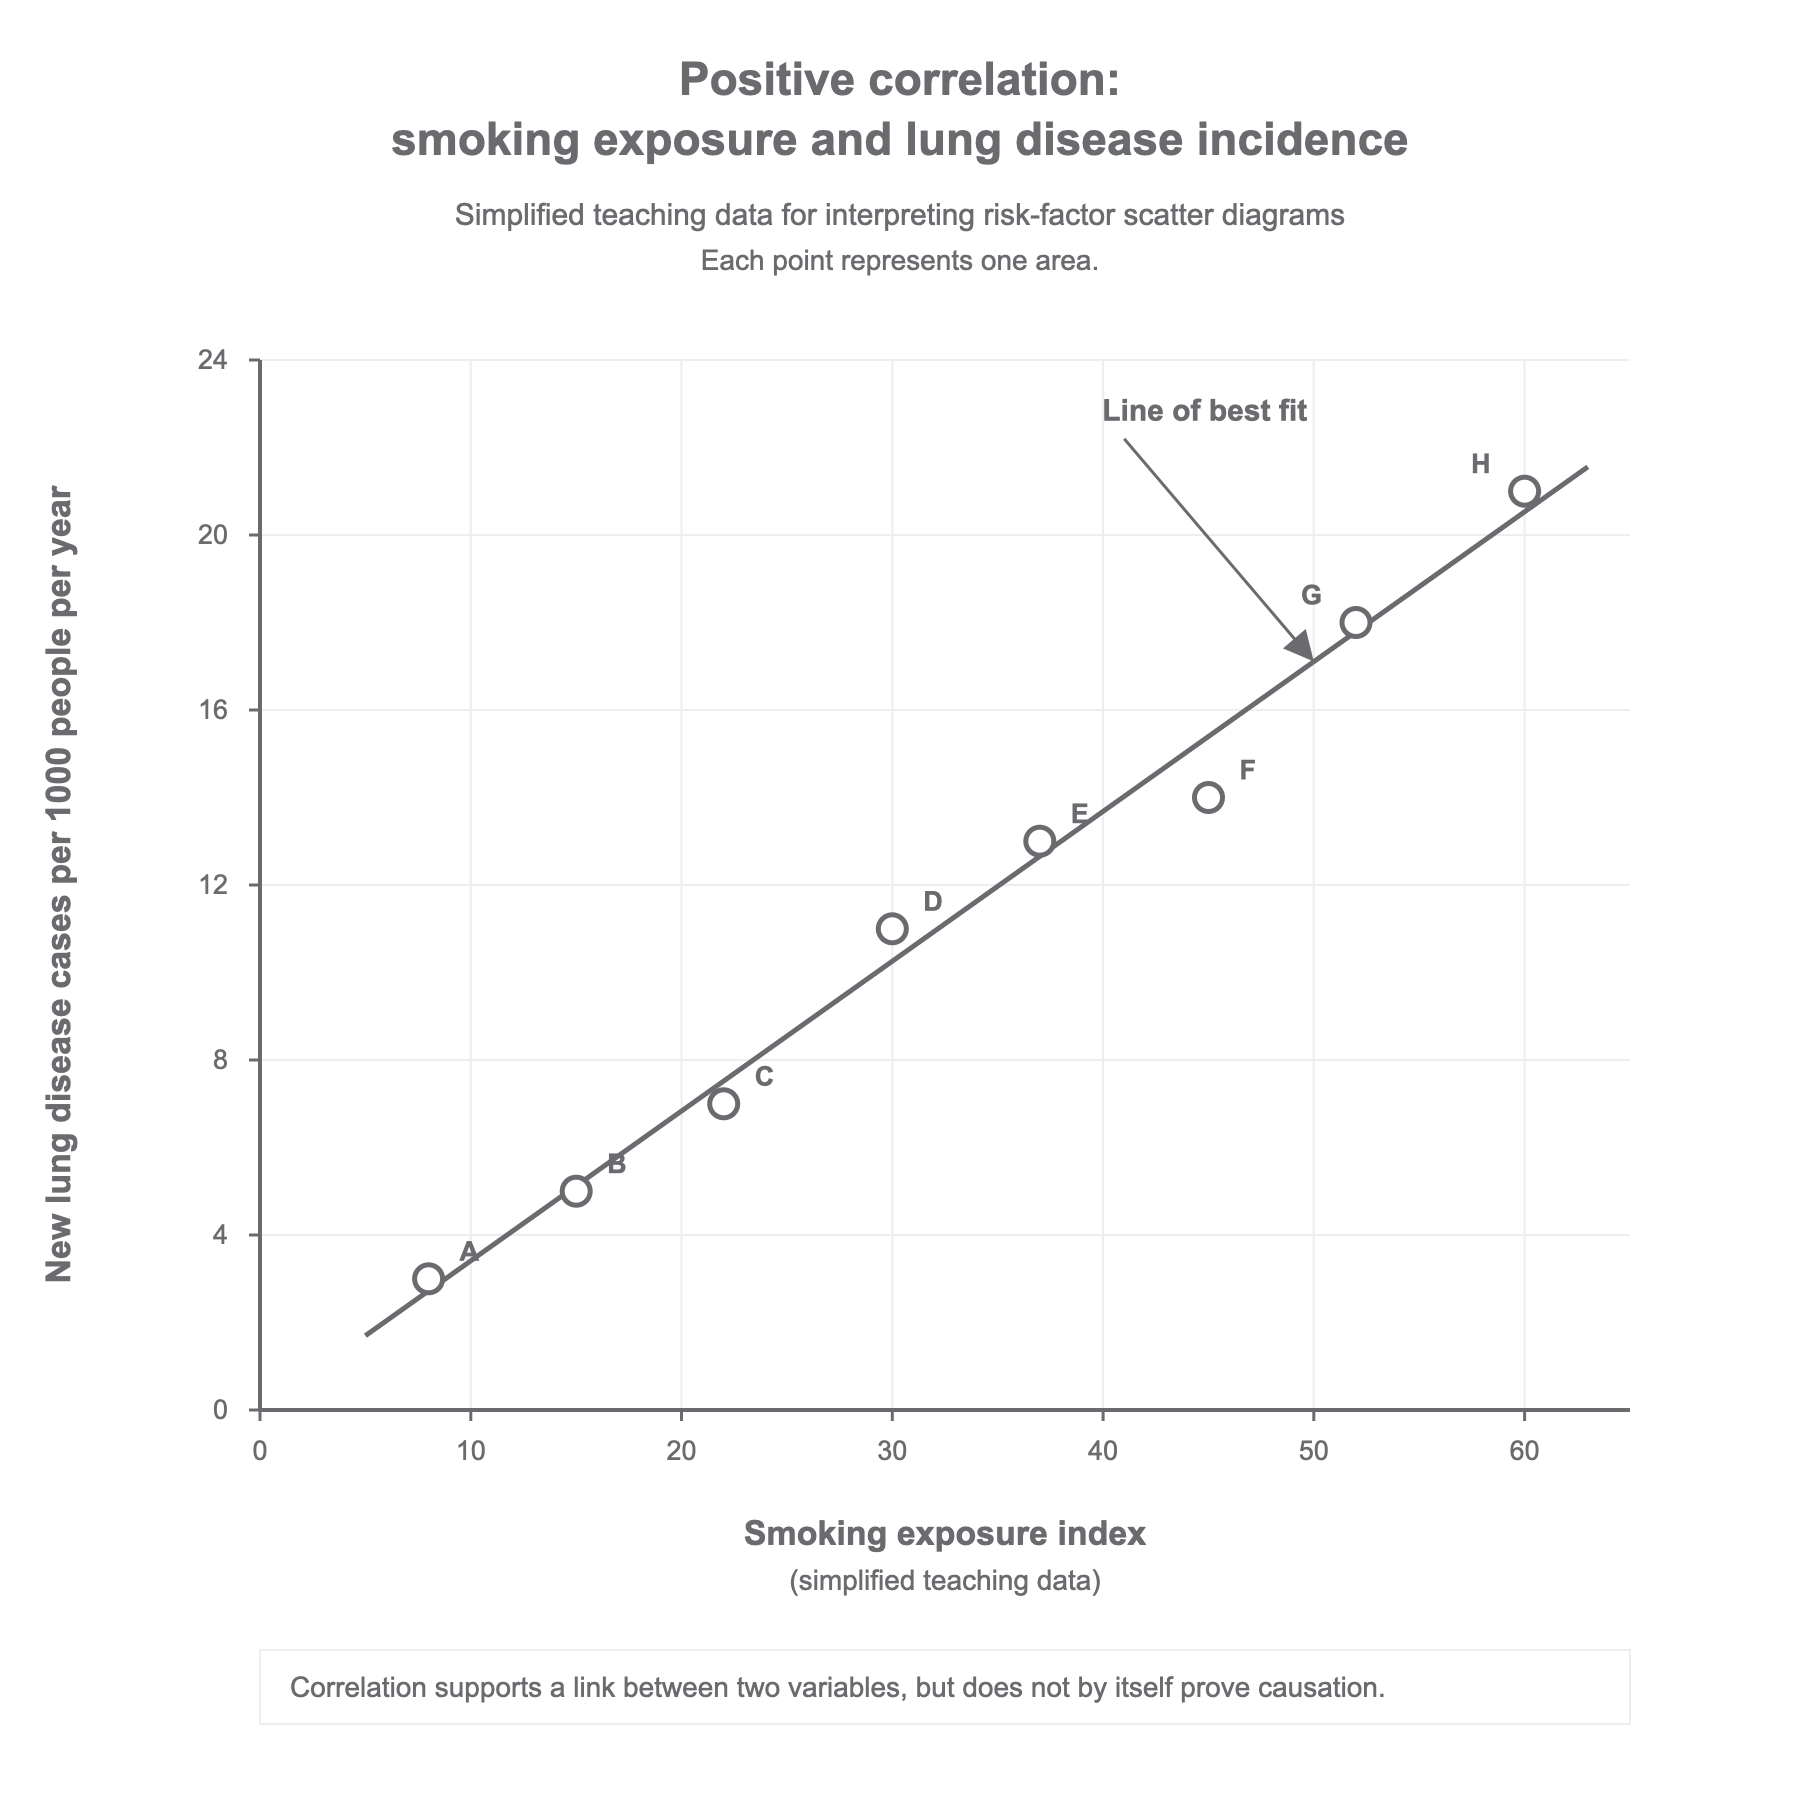
A positive correlation means that as one variable increases, the other variable tends to increase. A negative correlation means that as one variable increases, the other tends to decrease. No correlation means there is no clear pattern.
Use this simplified data table:
| Area | Smoking exposure index | New lung disease cases per 1000 people per year |
|---|---|---|
| A | 8 | 3 |
| B | 15 | 5 |
| C | 22 | 7 |
| D | 30 | 11 |
| E | 37 | 13 |
| F | 45 | 14 |
| G | 52 | 18 |
| H | 60 | 21 |
The table and scatter diagram show a positive correlation: areas with a higher smoking exposure index tend to have more new lung disease cases per 1000 people per year. The word tend matters because real data points do not usually form a perfect straight line.
When a question asks you to extract information from a chart, graph or table, quote the data. A weak answer says "smoking increases lung disease". A stronger answer says "as the smoking exposure index rises from 8 to 60, new lung disease cases increase from 3 to 21 per 1000 people per year, so there is a positive correlation."
Exam precision
In this specification point, exam questions often reward careful wording. Say risk factor rather than cause unless the question has given evidence for a causal mechanism. Say incidence when you mean new cases in a population over time. Use positive correlation, negative correlation or no correlation when describing a scatter diagram.
For named lifestyle factors, keep the link precise:
| Lifestyle factor or substance | Disease or effect named by AQA |
|---|---|
| Diet, smoking and exercise | Cardiovascular disease |
| Obesity | Type 2 diabetes |
| Alcohol | Liver damage and brain function |
| Smoking | Lung disease and lung cancer |
| Smoking and alcohol | Effects on unborn babies |
| Carcinogens, including ionising radiation | Cancer risk |
When evaluating risk-factor data, use both biology and data quality. A strong answer might say: "The data show a positive correlation, the sample is large and the mechanism is plausible, so the evidence supports a link. However, other factors may also affect the disease incidence, so the conclusion should not claim that the risk factor explains every case."
Risk-factor questions are about links between lifestyle, disease incidence, evidence quality and biological mechanism.
Use that sentence as a final check on your answer: if you have not mentioned the factor, the disease pattern and the strength of the evidence, the answer is probably incomplete.