4.2.2.5 - Health Issues and Disease Interactions
Health is not just the absence of disease. In this lesson, health means physical and mental well-being, and diseases are one major cause of ill health. You will also learn how different types of disease can interact, and how AQA expects you to handle disease incidence data.
Health and ill health
Health is the state of physical and mental well-being. This is broader than saying "I do not currently have a disease", because a person can be affected by stress, diet, life situations or mental illness even when they do not have an obvious infection.
Health
The state of physical and mental well-being.
A disease is a condition that stops part of the body or mind working normally. Diseases are major causes of ill health, but they are not the only causes. A poor diet, high stress and difficult life situations can all have a profound effect on physical and mental health.
Diseases can be grouped in two useful ways here. Communicable diseases can spread between organisms and are usually caused by pathogens. Non-communicable diseases cannot spread directly between organisms. AQA does not want this lesson to become a list of named diseases; the important idea is that both types can reduce well-being.
Communicable and non-communicable disease
A communicable disease can spread from one organism to another. Examples elsewhere in the course include diseases caused by bacteria, viruses, fungi and protists. For this lesson, keep the focus on the relationship with health: communicable diseases can cause ill health because pathogens damage tissues, live in cells, or trigger immune responses.
A non-communicable disease does not spread directly between organisms. Non-communicable diseases can still be major causes of ill health because they may damage organs, limit normal activity, cause pain, affect mental health, or require long-term treatment.
The boundary between the two groups is useful, but real health issues are often more connected than a neat table suggests. A person can have more than one disease at the same time, and one disease can increase the chance or severity of another.
For AQA, health is affected by communicable diseases, non-communicable diseases and wider factors such as diet, stress and life situations.
This comparison is often worth only a few marks, so make the contrast direct and avoid drifting into examples unless the question asks for them.
How diseases interact
Different types of disease may interact. This means one disease or health problem can make another disease more likely, trigger another condition, or make the effect on the person more severe.
| Interaction | AQA meaning |
|---|---|
| Defects in the immune system | The immune system is less able to defend the body, so infectious diseases are more likely. |
| Viruses living in cells | Some viruses can be a trigger for cancers. |
| Immune reactions after a pathogen | An immune reaction initially caused by a pathogen can trigger allergies such as skin rashes and asthma. |
| Severe physical ill health | Severe physical illness can lead to depression and other mental illness. |
These points are links, not full disease stories. For example, you do not need to describe exactly how a virus changes a cell into a cancer cell in this lesson. You need to be able to describe the interaction clearly: a virus lives in cells and can trigger cancer.
Now turn those links into short, precise exam statements rather than long descriptions of each disease.
Disease incidence data
Disease incidence means the number of new cases of a disease in a stated population during a stated time period. Incidence is often converted into a rate so that different-sized populations can be compared fairly.
Worked example:
In one year, a town of 5000 people has 25 new cases of a disease. Calculate the incidence per 1000 people.
- Divide new cases by population:
25 ÷ 5000 = 0.005 - Convert to per 1000 people:
0.005 × 1000 = 5 - Incidence =
5 new cases per 1000 people per year
Incidence per 1000 people
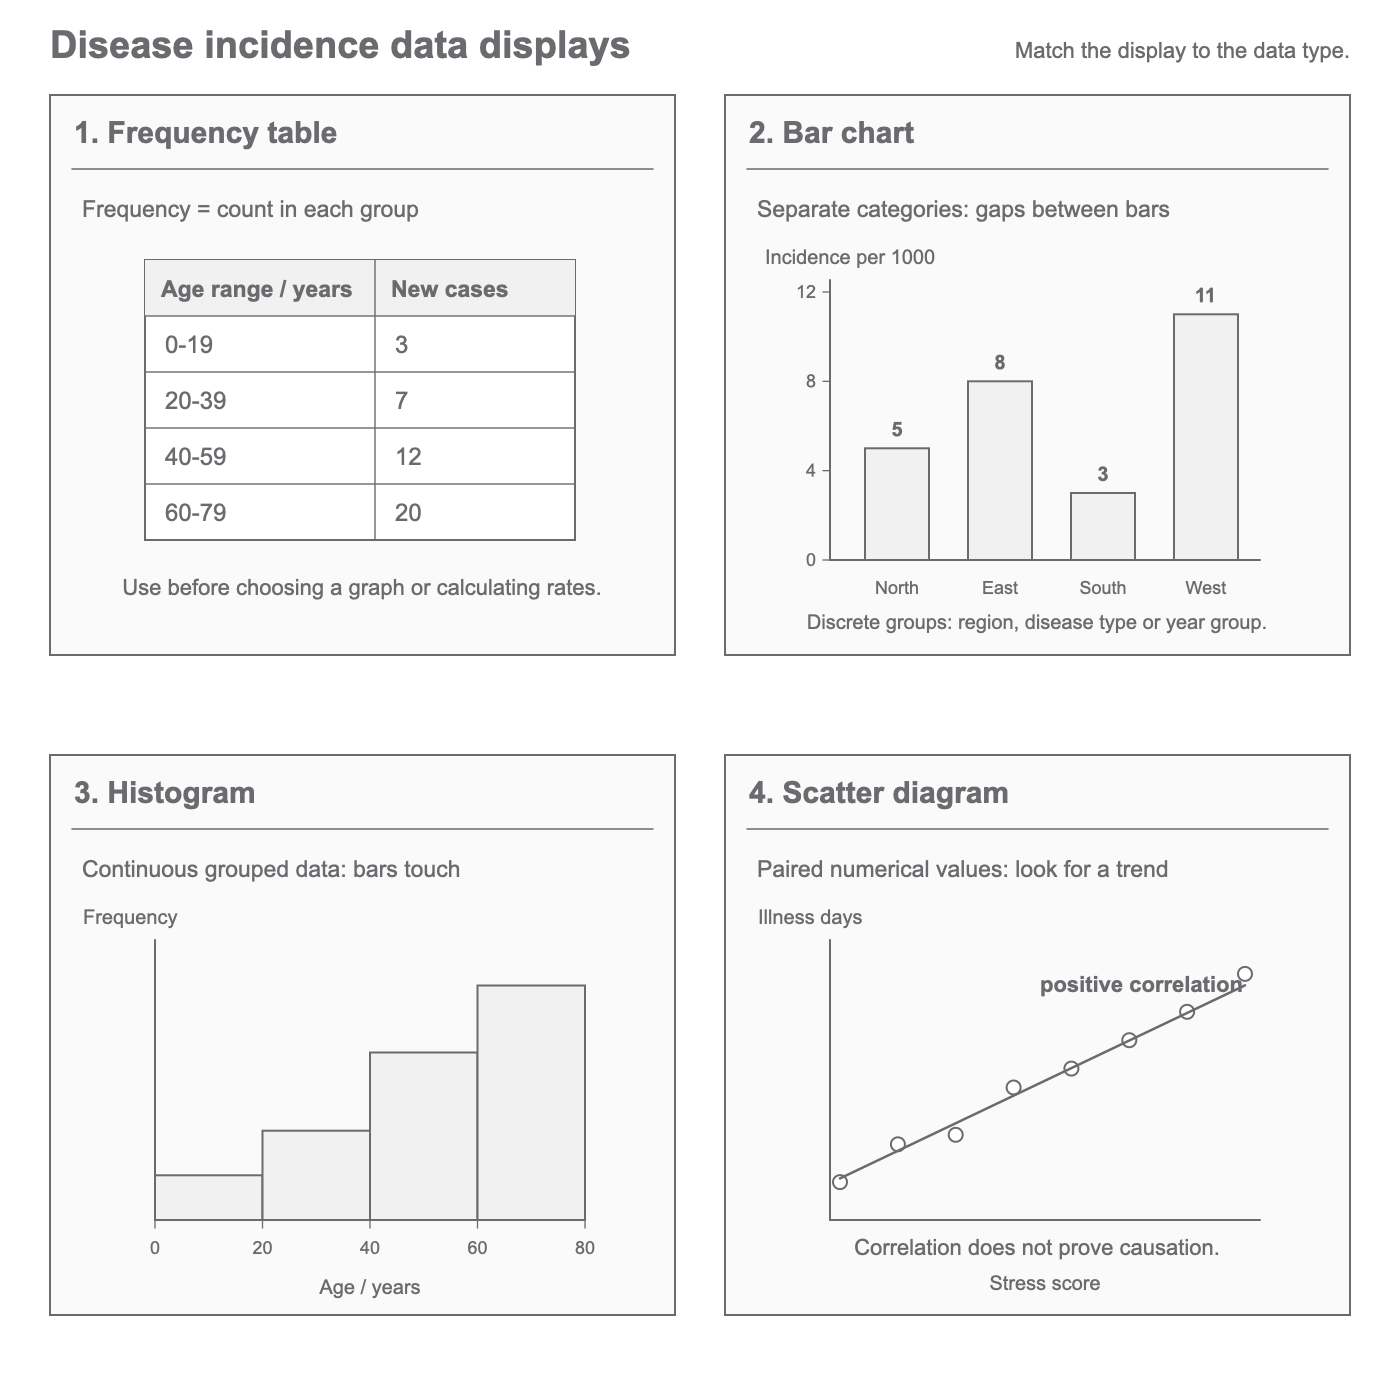
AQA says you should translate disease incidence information between graphical and numerical forms. That means you may be given a graph and asked for a value, or given a table and asked which graph would show the data clearly.
[DIAGRAM: asset_name: incidence-data-displays - diagram 1; asset_slug: 024_4_2_2_5_health_issues_and_disease_interactions_diagram1; file: diagram_assets/024_4_2_2_5_health_issues_and_disease_interactions_diagram1.png; recommended_method: deterministic_drawn; description: Monochrome four-panel teaching visual showing the same kind of epidemiological incidence data represented as a frequency table, a bar chart for discrete categories, a histogram for grouped continuous age ranges, and a scatter diagram with positive correlation; labels highlight axes, frequency, incidence per 1000 people, and that correlation does not prove causation.]
Tables, charts and histograms
A frequency table records how often each value or category occurs. Disease incidence data can be organised in frequency tables where the frequency might be the number of new cases, the number of people in a symptom group, or the number of people in each age range.
Frequency diagrams show those frequencies visually. When you construct one, use a clear title, label the axes, include units where needed, and choose a sensible scale so the pattern can be interpreted accurately.
Use a bar chart when the categories are separate groups, such as disease type, region or year group. The bars usually have gaps because the categories are discrete. Use a histogram when the data are continuous and grouped into intervals, such as age ranges or time intervals. Histogram bars touch because the intervals join together.
When you interpret a table, bar chart or histogram, do more than say "it goes up" or "it is high". A strong GCSE answer names the variable, quotes a value if useful, and states the pattern. For example: The incidence is highest in the 70-79 age group at 22 new cases per 1000 people.
Correlation and sampling
A scatter diagram is used to look for a correlation between two numerical variables. Each point represents one paired set of values, such as a person's stress score and number of illness days, or the number of new disease cases in different sample groups over the same time period. If the points generally rise from left to right, there is a positive correlation. If they fall from left to right, there is a negative correlation. If there is no clear pattern, there is no clear correlation.
Correlation
A relationship between two variables where a change in one variable is associated with a change in the other.
Correlation does not prove that one variable causes the other. A third factor might affect both variables, the sample might be biased, or the pattern might be due to chance. In an exam, use cautious wording such as the data show a positive correlation rather than this proves that the first variable caused the disease.
Sampling matters because epidemiological data usually describe a population, but scientists often collect data from a sample of that population. A good sample should be large enough, chosen in a way that reduces bias, and representative of the population being studied. If only one type of person is included, the results may not apply to the whole population.
Exam precision
For health questions, use the exact AQA wording: health is the state of physical and mental well-being. Do not define health only as "not being ill". Also avoid writing that communicable and non-communicable diseases never interact, because the specification gives several examples where they do.
For disease data questions, read the axes, headings and units before answering. Number of cases and incidence per 1000 people are not the same thing. Incidence rates are useful because they make populations of different sizes easier to compare.
For sampling questions, name the population being studied and ask whether the sample represents it. A large biased sample can still give misleading results, while a smaller well-chosen sample may be more useful than a convenience sample.