EN2 - Tree diagrams, tables and Venn diagrams
A good picture keeps track of outcomes without missing any or counting one twice. You will construct and use trees for successive choices, two-way tables for paired outcomes and Venn diagrams for overlapping groups. The picture you choose depends on what the outcome actually records.
Listing successive outcomes with a tree
Roll two fair four-sided dice and record the higher score. Is a recorded score of four times as likely as a recorded score of ? A list of possible recorded scores, , hides something important: several different dice outcomes give the same recorded score. We will uncover exactly how many.
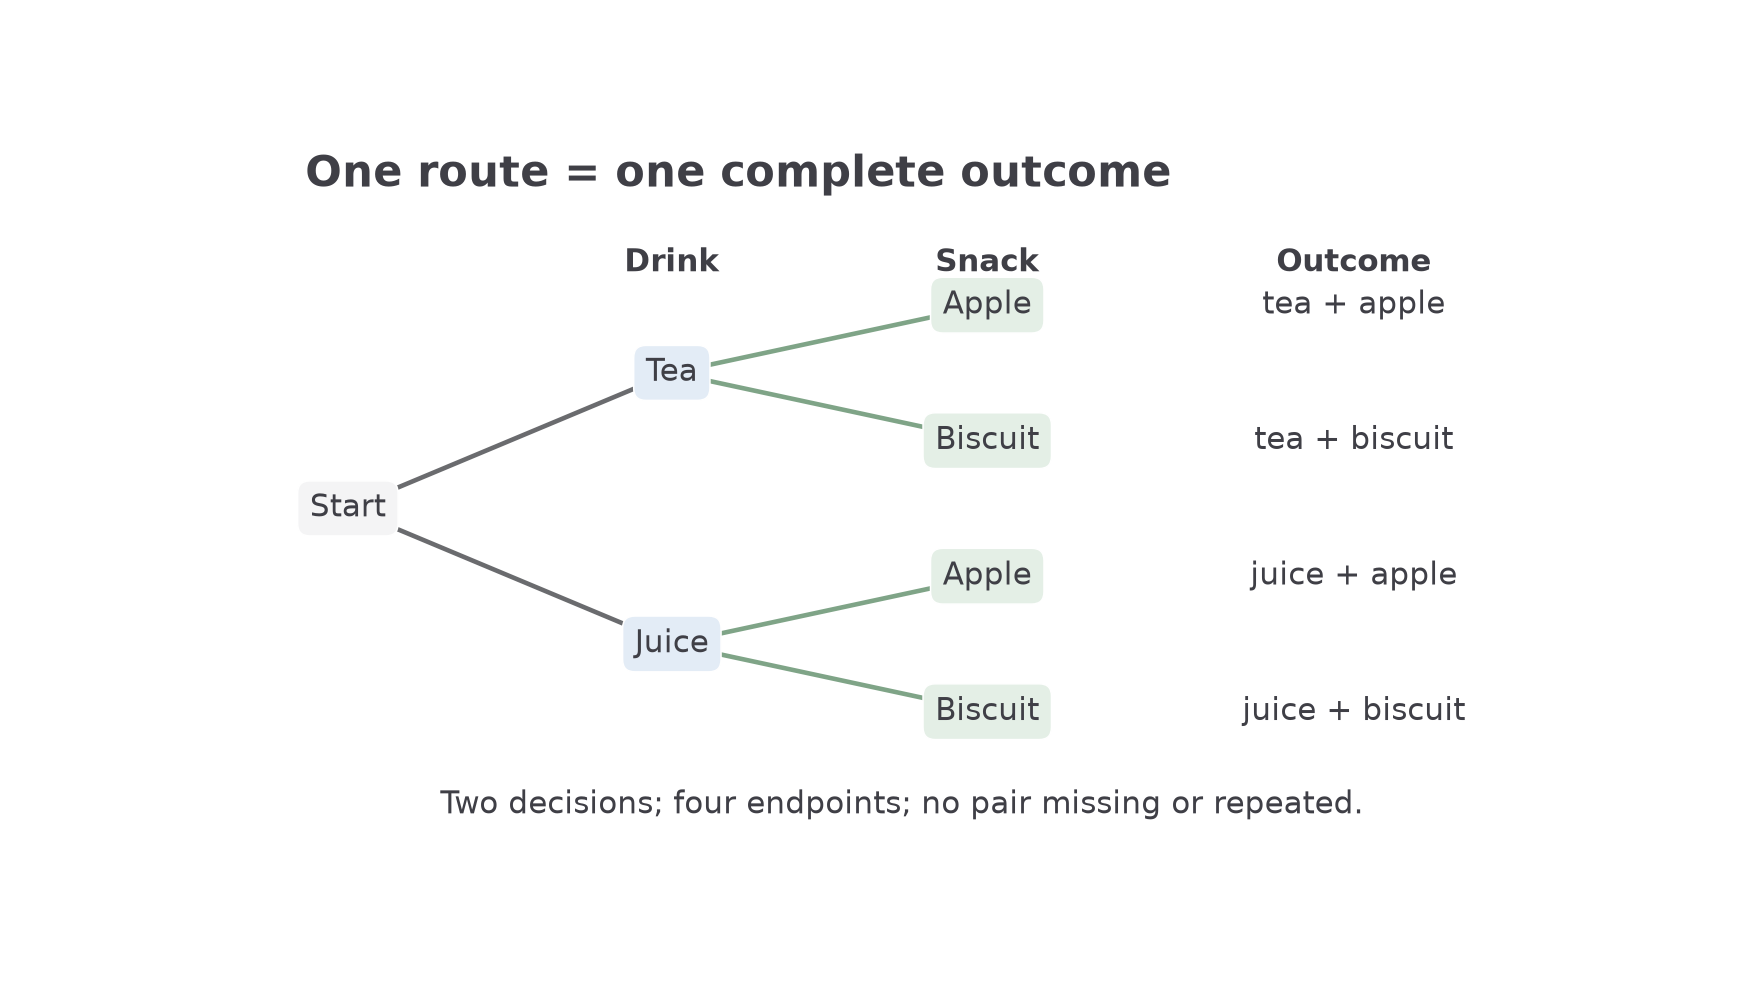
Start with a smaller task. Choose a drink, tea or juice, then a snack, apple or biscuit. A tree gives each decision its own stage. Follow a route from left to right to read one complete outcome.
You already know
A sample space lists all possible outcomes. For equally likely outcomes, . This counting rule is not on the formulae sheet: learn it. Outcomes must really be equally likely before you use it.
The first choice does not complete the outcome: “tea” must be followed by a snack. Each final endpoint represents a complete pair, and every allowed pair needs exactly one endpoint.
[DIAGRAM: asset_name: A tree of drink and snack choices; asset_slug: en2-choice-tree; caption: Each complete route records one drink and one snack; description: A left-to-right tree splits first into tea and juice, then each drink splits into apple and biscuit. Four endpoints are labelled tea apple, tea biscuit, juice apple and juice biscuit. Stage headings identify drink and snack.]
Outcome tree
A tree diagram represents successive stages by branches. A complete route from the starting point to an endpoint represents one outcome. For example, tea then apple is one outcome. Tea on its own is not a complete outcome of choosing both a drink and a snack.
Draw the stages in a fixed order, include every allowed branch, then read the endpoints systematically. If an earlier choice removes a later option, the relevant branch must disappear.
Worked example 1: all pairs are allowed
Question. A code consists of one letter, or , followed by one digit, or . Use a tree to list its possible codes.
Plan. Draw two first-stage branches, then attach all three digit branches to each.
Why branch again from both letters? Either letter can be followed by any of the three digits; stopping after the first stage would miss half the code.
Answer. : codes.
Check. The lists starting with and have no code in common, and each contains every permitted digit.
The next example changes one feature: an earlier choice now removes a later choice. The second stage depends on the first.
Worked example 2: an object cannot be chosen twice
Question. Three cards are labelled . Two cards are drawn in order without replacement. Use a tree to list the outcomes.
Plan. Give the first draw three branches, then omit that drawn card from its second-stage branches.
Why keep and ? The outcome records the order of the draws. They follow different routes, even though they use the same cards.
Answer. : outcomes.
Check. No listed outcome repeats a card, and each possible first card appears twice.
A tree is a record of the rules, so changing those rules changes its branches.
Watch out
Wrong: include when drawing without replacement from one card. There is no left for the second draw. Right: after , branch only to and . With replacement, would be allowed.
Try the same structure with one extra card. You can describe each set of branches in text; a separate drawing is unnecessary here.
Counting paired outcomes with a two-way table
A two-way table puts the first outcome down the rows and the second across the columns, so every cell stands for one ordered pair.
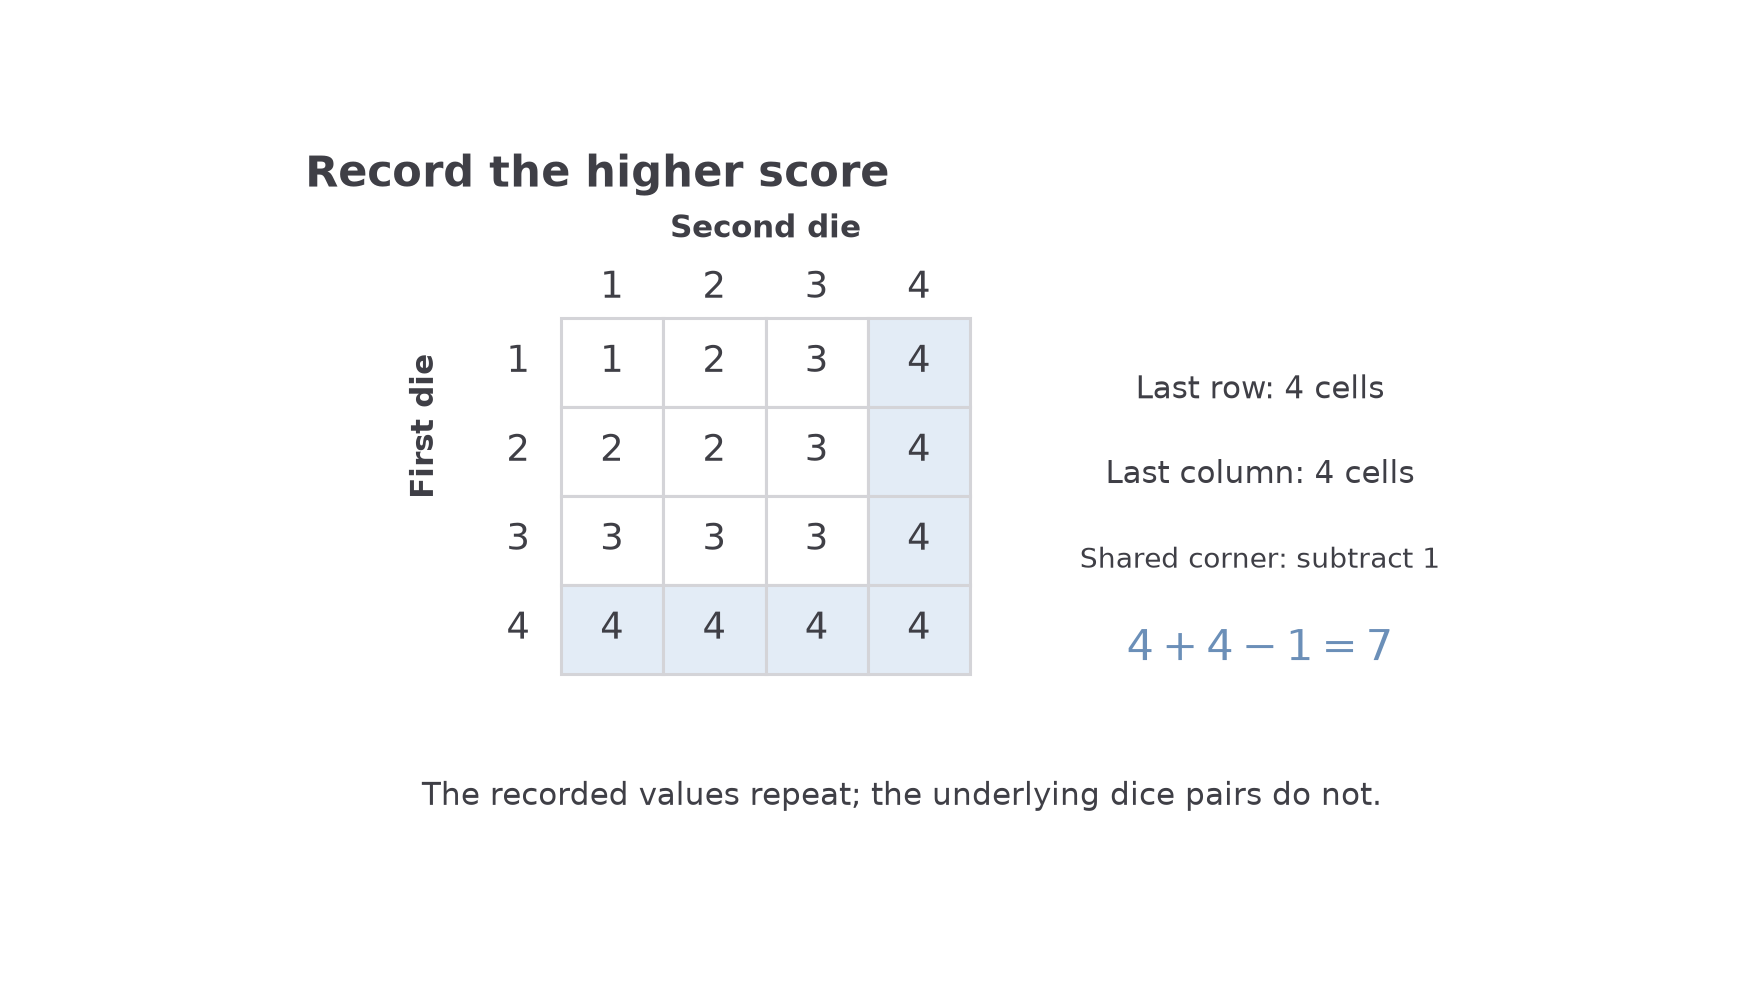
For two four-sided dice, label the rows with the first die's scores and the columns with the second die's scores. The cell in row , column represents ; row , column represents . These are different outcomes even if the quantity recorded is the same.
Two-way outcome table
A two-way outcome table has one possible first-stage result per row and one possible second-stage result per column. Fill each cell using the stated rule. A repeated value in several cells represents several different underlying outcomes, not a duplicate to remove.
For our opening question, put the higher of the two scores in each cell. Read the rule carefully: adding the scores would answer a different question.
[DIAGRAM: asset_name: Higher score from two four-sided dice; asset_slug: en2-higher-score-table; caption: Seven of the sixteen equally likely dice pairs have higher score 4; description: A four-by-four outcome table has row and column headings 1 to 4. Each cell shows the maximum of its row and column headings. The last row and last column are pale blue with their common corner counted once. The seven highlighted cells contain 4; the upper-left cell alone contains 1.]
Worked example 3: a square outcome table
Question. Two fair four-sided dice, each numbered to , are rolled. The higher score is recorded. Find the probabilities of recording and of recording .
Plan. Fill the outcome table with the higher score, then count the relevant cells.
Why subtract ? The corner belongs to both the last row and the last column; it is only one cell.
Answer. and .
Check. The counts for recorded scores are , which sum to . Thus is seven times as likely as , answering the opening question.
Here is a pleasing pattern hidden in the picture: the first odd numbers sum to . Each new outside row and column enlarges a square by the next odd number of cells. In particular, .
The next example changes only the second die: the table becomes a rectangle.
Worked example 4: a rectangular outcome table
Question. A fair four-sided die numbered to and a fair five-sided die numbered to are rolled. The higher score is recorded. Find the probability of recording .
Plan. Use four rows and five columns, then count cells whose higher score is .
Why exclude the last cell in row ? It represents , whose higher score is .
Answer. .
Check. There are cells recording , recording and recording ; together with the earlier cells, that gives .
Equal chances attach to the dice pairs, not to the values written in the cells.
Watch out
Wrong: “The recorded score is one of , so each has probability .” The four values occur in different numbers of cells. Right: count equally likely underlying pairs before forming the probability.
Change the first die's range again and keep the recorded-value rule fixed.
Separating overlapping groups in a Venn diagram
A Venn diagram separates a collection into regions, so a person belonging to two groups is still counted once.
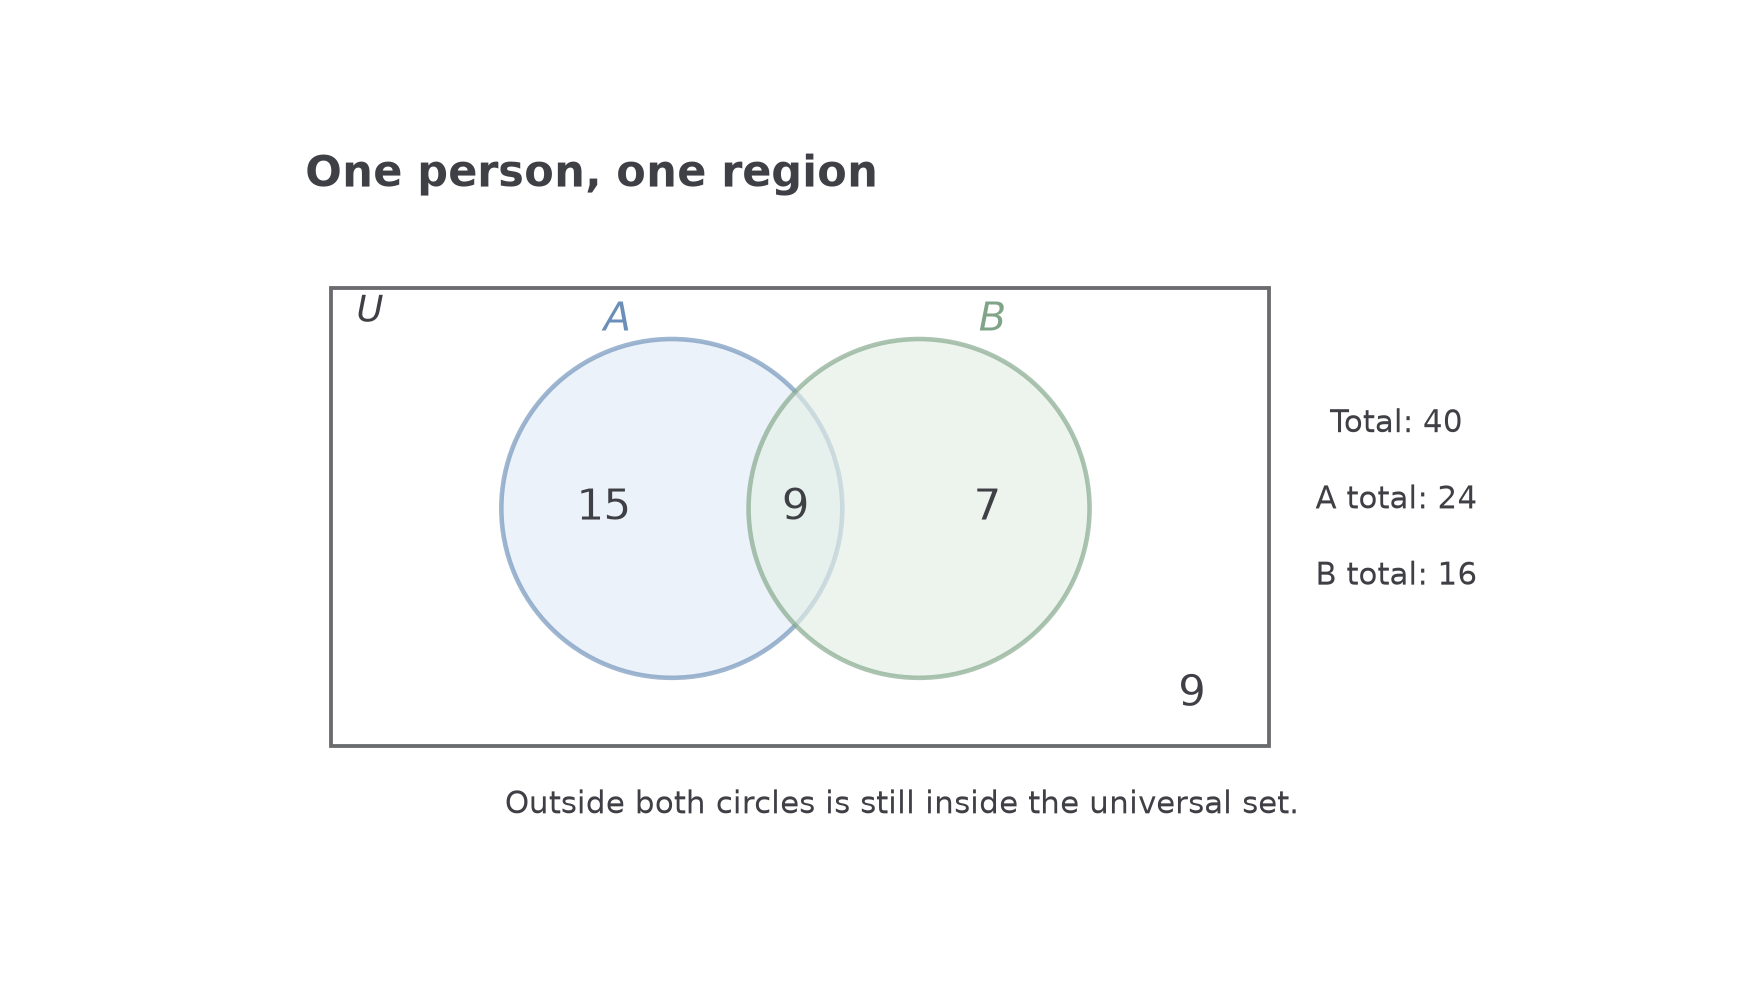
The rectangle is the universal set: everyone or everything under discussion. Circles show membership of particular sets. The overlap means both; outside both circles but inside the rectangle means neither. “Neither” is a region, not a third circle.
Intersection, union and complement
means both and ; means or , including both. The complement means everything in the universal set that is not in . For example, a member of only belongs to . The complement is not just the region outside both circles.
Write numbers into the non-overlapping regions. If people belong to , and of those also belong to , the -only region contains , not .
[DIAGRAM: asset_name: Membership totals and disjoint Venn regions; asset_slug: en2-two-set-venn; caption: The total in set A includes its overlap with set B; description: A labelled universal-set rectangle containing two overlapping circles A and B. The A-only region contains 15, the overlap contains 9, B-only contains 7, and the outside region contains 9. A note states total 40; A total 24; B total 16.]
Worked example 5: start with the overlap
Question. Of students, study art, study music and study both. Determine how many study neither.
Plan. Put in the overlap, subtract it from each set total, then subtract all occupied regions from .
Why not subtract from ? The in both sets would have been subtracted twice.
Answer. students study neither.
Check. The four regions total , while the art and music totals are and .
The next example changes the supplied region: you know “neither” and must recover “both”.
Worked example 6: recover the overlap
Question. Of students, cycle, swim and do neither. Determine how many do both.
Plan. Find the total in at least one set, then account for the repeated count in the sum of the set totals.
Why does the excess give “both”? Everyone in one set is counted once in , while everyone in both is counted twice.
Answer. students do both.
Check. The disjoint regions give .
The same double-counting correction can be written using counts, or using probabilities.
Combining two overlapping sets
Here is the number in the finite set .
Not on the formulae sheet: learn it.
The same correction applies to probability: adding the two probabilities counts their overlap twice. This version is printed on the June 2027 extra sheet.
Probability of either event
This holds for any two events and .
On the formulae sheet.
Keep the enclosing rectangle visible in a drawn answer. Its boundary tells the reader where the complement ends.
Watch out
Wrong: put the total in the cycle-only region, then add in the overlap. That would make cyclists. Right: put in cycle only and in both. Draw the universal-set rectangle and put “neither” outside the circles, inside it.
Use the same reasoning when the set totals are larger.
Building a three-set Venn diagram from the centre
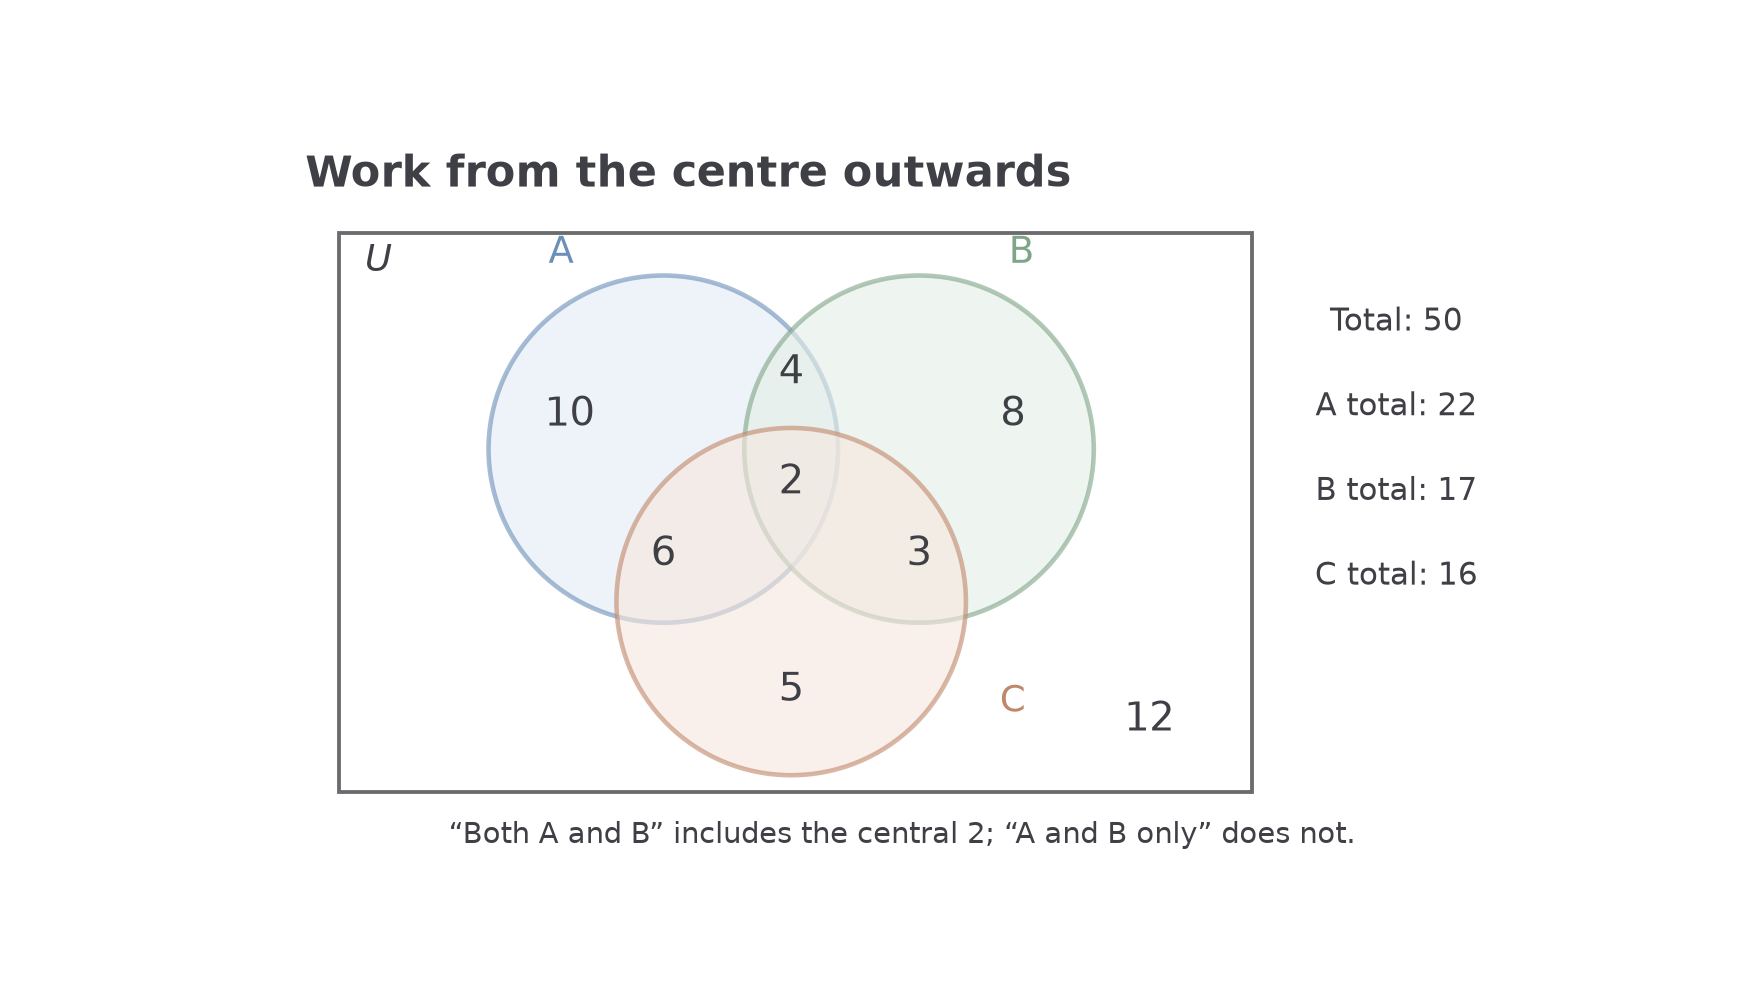
With three sets, start in the triple overlap and work outwards; a total for “both” can include people in all three.
There are seven regions inside at least one of three circles, plus the region outside them all. For instance, “ and ” includes the triple overlap, whereas “ and , but not ” names just one region. Read that distinction before doing arithmetic.
Exactly two and at least two
A member of exactly two sets belongs to one of the three pair-only regions. A member of at least two sets belongs to one of those regions or to all three. For example, someone in counts towards “at least two”, but not “exactly two”.
The picture below separates totals from regions. Each number belongs in one region only.
[DIAGRAM: asset_name: Eight regions of three overlapping sets; asset_slug: en2-three-set-venn; caption: Fill the triple overlap before the pair-only regions and then the single-only regions; description: Three overlapping circles A, B and C within a universal-set rectangle, with region values A only 10, B only 8, C only 5, A and B only 4, A and C only 6, B and C only 3, all three 2, and neither 12. A legend gives universal total 50, A total 22, B total 17, C total 16.]
Worked example 7: inclusive pair totals
Question. In a group of , belong to , to and to . Also belong to both and , to both and , to both and , and to all three. Find the number in none of the sets.
Plan. Subtract the triple overlap from each pair total, then complete the single-only and outside regions.
Here is shorthand for the region in and , but not .
Why begin at the centre? Its is included in every inclusive pair total and in every set total. Removing it first prevents those people appearing in several separate regions.
Answer. belong to none.
Check. Set contains ; the eight regions total .
The next example changes only the wording of the pair information: the pair-only regions are supplied directly.
Worked example 8: pair-only totals
Question. A survey of people gives , , . There are in and only, in and only, in and only, and in all three. Find how many belong to none of the sets.
Plan. Keep the supplied pair-only numbers unchanged and subtract the other three regions from each set total.
Why not subtract from the pair-only values? The wording has already excluded the triple overlap from them. This describes exactly the same group as Worked example 7, but the pair-only regions are now supplied directly.
Answer. belong to none.
Check. The union contains , leaving outside. All region counts are non-negative and total , as before.
Negative region counts are a useful alarm: they indicate inconsistent data or an earlier subtraction error. All region values here are whole-number counts.
Watch out
Wrong: treat “ in and ” as “ in and only” when are in all three. Right: the pair-only region is . The word “only” changes what the number includes.
Try the same construction for a fresh survey. The pair-only counts are again supplied directly.
Quick Recap
- A complete tree route represents one complete outcome; update later branches when an object is removed.
- A two-way table distinguishes underlying pairs, even when several pairs produce the same recorded value.
- Put Venn counts in disjoint regions inside a universal-set rectangle.
- With three sets, fill the triple overlap first; distinguish “both” from “both only”.
The opening question: the higher score is in of the equally likely pairs, and in only . The ratio is .