CG4 - Sketching and plotting polynomial graphs
A graph turns an equation into a picture of all its solutions. You will plot straight lines and polynomial curves accurately, and make quick sketches from roots, intercepts and signs. You will also learn when a table of values can hide a bend, so that a neat drawing does not tell the wrong story.
Plotting straight lines
Could three correct plotted points persuade you to draw the wrong graph? For , the values at are all zero. Joining just those points along the axis would conceal the curve completely: at , its height is . A straight line and a polynomial curve need different plotting decisions.
You already know
Substitute a chosen into an expression to find . The solutions of are its roots. A factor gives a root , by the factor theorem.
Start with lines, where the plotting job is simpler. Two distinct points fix a straight line; a third point checks the arithmetic. Choose a clear scale on each axis, label both axes and plot coordinate pairs in the order . The two axis scales may differ, but each scale must be uniform.
Plot and sketch
To plot a graph, calculate and mark accurate points using a stated scale, then draw the appropriate line or smooth curve. To sketch a graph, show its main shape and features, including labelled intercepts; exact scale is unnecessary. An intercept is where a graph meets an axis: use for the vertical intercept and for horizontal intercepts.
A linear function has the form , with constants and ; its graph is a straight line. This form is not on the formulae sheet: learn it. We will interpret the gradient in more detail in the next lesson.
Worked example 1: plotting a rising line
Question. Plot for , stating both axis intercepts.
Plan. Calculate three points, draw the straight line through them, then set each coordinate to zero in turn.
Use one-unit scales, mark , and , and draw one straight segment across the specified interval. The left panel below shows the result.
Why use three points? The third checks that a substitution or plotting error has not bent a line that should be straight.
Answer. A straight line through the plotted points, with intercepts and .
Check. The vertical intercept also lies on the line through the table points, and .
The next example changes only the sign of the coefficient of . The vertical intercept stays put while the line falls instead of rising.
Worked example 2: plotting a falling line
Question. Plot for , stating both axis intercepts on the full line.
Plan. Recalculate the same three heights and find the intercepts by substitution.
Mark , , and draw their straight segment. The horizontal intercept belongs to the extended line, outside the requested interval; the right panel shows that extension dashed.
Why mention the interval? A correct feature of the full line need not lie on the portion you were asked to plot.
Answer. The line falls through the table points; the full line's intercepts are and .
Check. , and each increase of in lowers by .
The plots make the sign change visible while keeping the scales fixed.
[DIAGRAM: asset_name: Two accurately plotted straight lines; asset_slug: cg20-linear-plots; caption: Changing the sign of the coefficient changes rising to falling while keeping the vertical intercept; description: Two coordinate grids plot y equals 2x minus 3 and y equals minus 2x minus 3. Clay points mark the calculated values at x equals minus 1, 1 and 3. Blue solid segments show the requested interval minus 1 to 3; dashed extensions reveal the full lines and their axis intercepts.]
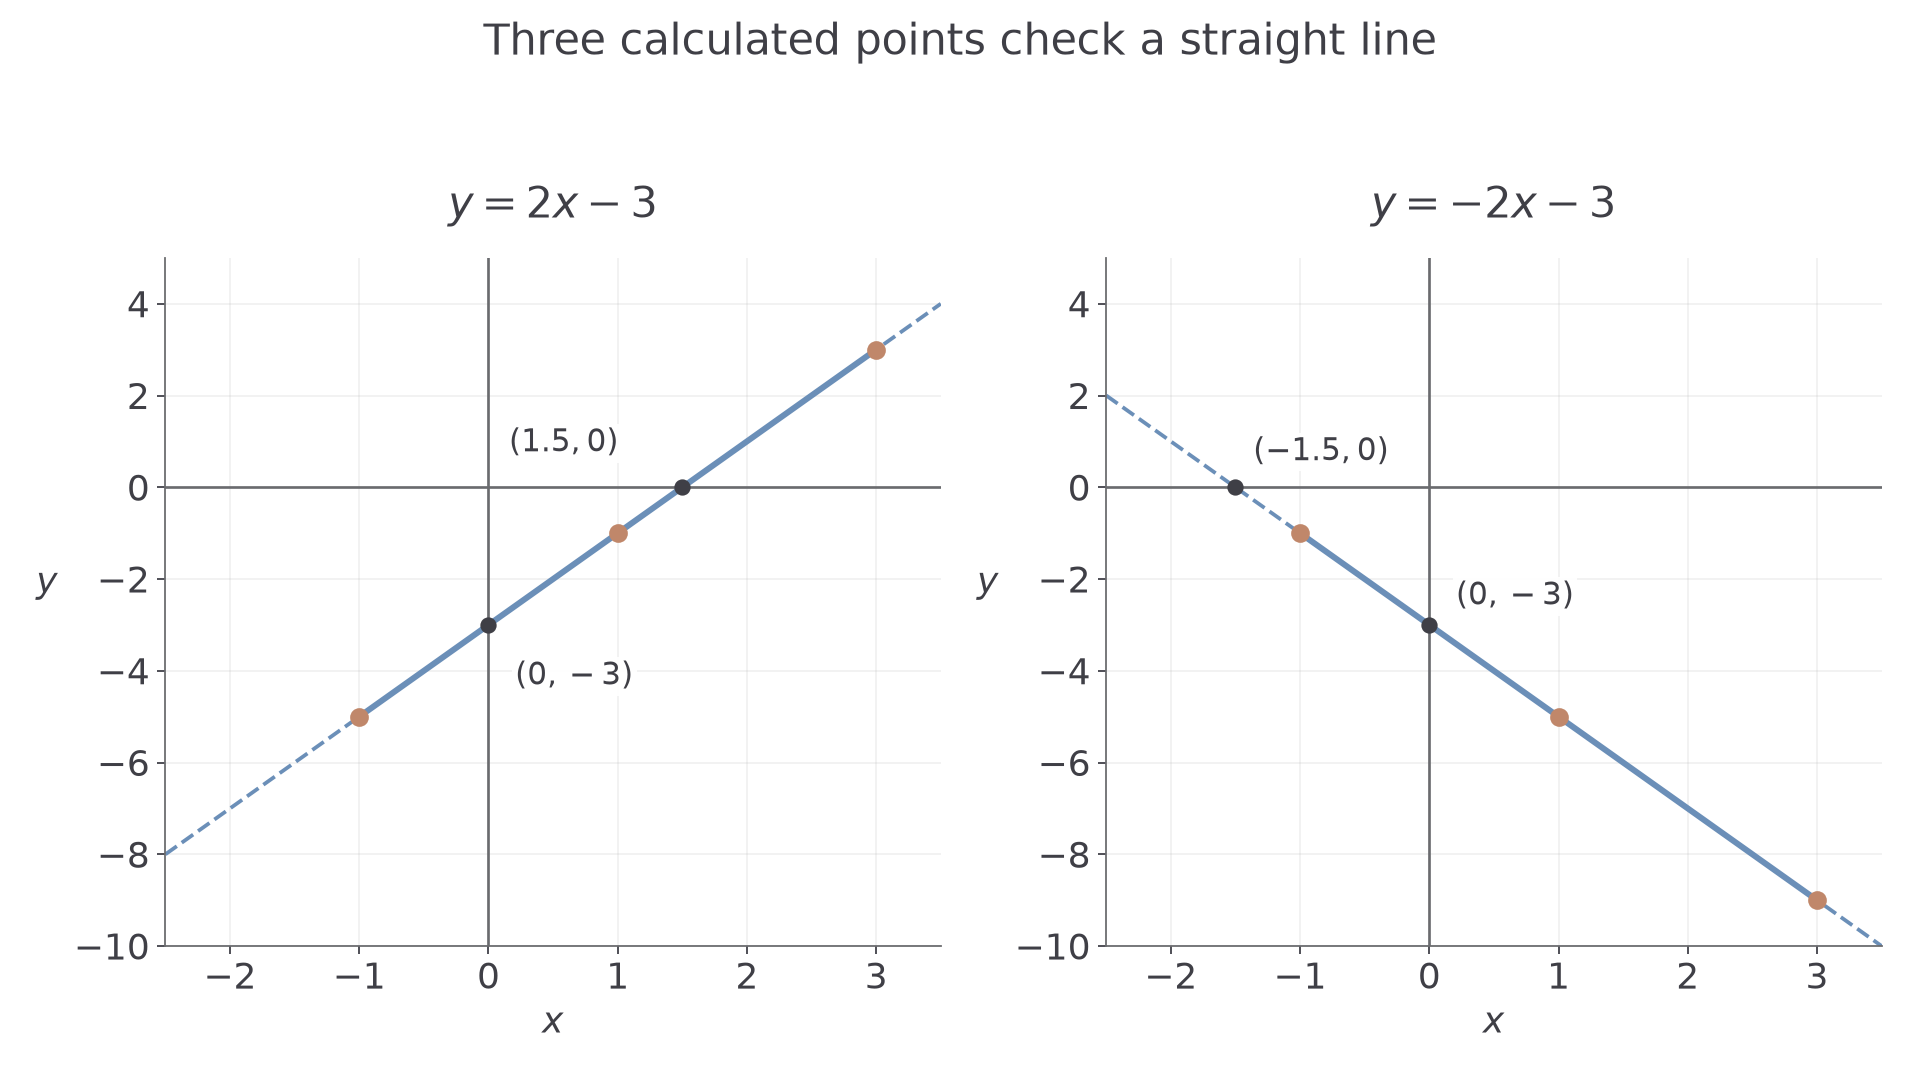
A line is not a collection of isolated plotted dots: it includes every point between them that satisfies the equation.
Watch out
Wrong: plot when the table says , . Coordinate order matters. Move horizontally to , then vertically to , and check one substitution after drawing.
Now keep the falling coefficient and change only the constant.
Sketching polynomial graphs from factors
Factors reveal where a polynomial meets the horizontal axis and whether its sign changes there; its highest-power term tells you how the graph behaves far to the left and right.
A polynomial is a sum of constant multiples of non-negative whole-number powers of , such as . Expressions such as and are not polynomials. Its degree is its highest power with a non-zero coefficient. Polynomial graphs are continuous and smooth: draw no jumps, gaps or sharp corners.
Multiplicity of a root
A root has multiplicity if is a factor and the remaining factor is non-zero at . For an odd multiplicity the graph crosses the axis; for an even multiplicity it touches the axis and turns back. For example, has a double root at ; two equal factors give one intercept, not two different intercepts.
Here is why the rule works. Near , the remaining factor keeps the same sign. An odd power of changes sign as passes ; an even power stays non-negative. A triple root crosses with a flattened shape, whereas a double root touches. These multiplicity and sign rules are not on the formulae sheet: learn them.
For end behaviour, the highest power dominates when is large. With a positive leading coefficient, an even degree rises at both ends, while an odd degree falls to the left and rises to the right. A negative leading coefficient reverses both directions. These end-behaviour rules are not on the formulae sheet: learn them.
Worked example 3: three distinct roots
Question. Sketch , showing the axis intercepts.
Plan. Find roots and the vertical intercept, check the sign between roots, then join smoothly with the correct ends.
Draw the curve from the lower left, crossing at , passing through , crossing at and , then rising to the right. The left panel below shows these features. Exact turning-point coordinates are not needed for this sketch.
Why check signs? Roots locate crossings, but signs tell you which side of the axis each joining section must occupy.
Answer. A smooth cubic through the four labelled intercepts, crossing at every root.
Check. At , , agreeing with the dip between and .
Change just the final factor from to . Two simple roots merge into one double root, so a crossing becomes a touch.
Continue this lesson.
You’re previewing NovaLearn without an account. Create a free account to read the rest.
Create free account