RP03 - Investigation of How the Rate of a Reaction Changes with Temperature
In this required practical, you do not track concentration continuously with an instrument. Instead, you time how long it takes for a fixed amount of sulfur to form as sodium thiosulfate reacts with hydrochloric acid. By keeping everything except temperature the same, you can use that time to compare rates and explain, in particle terms, why warmer mixtures react faster.
What the disappearing cross measures
The reaction used in this practical is:
Na2S2O3(aq) + 2HCl(aq) -> 2NaCl(aq) + SO2(g) + S(s) + H2O(l)
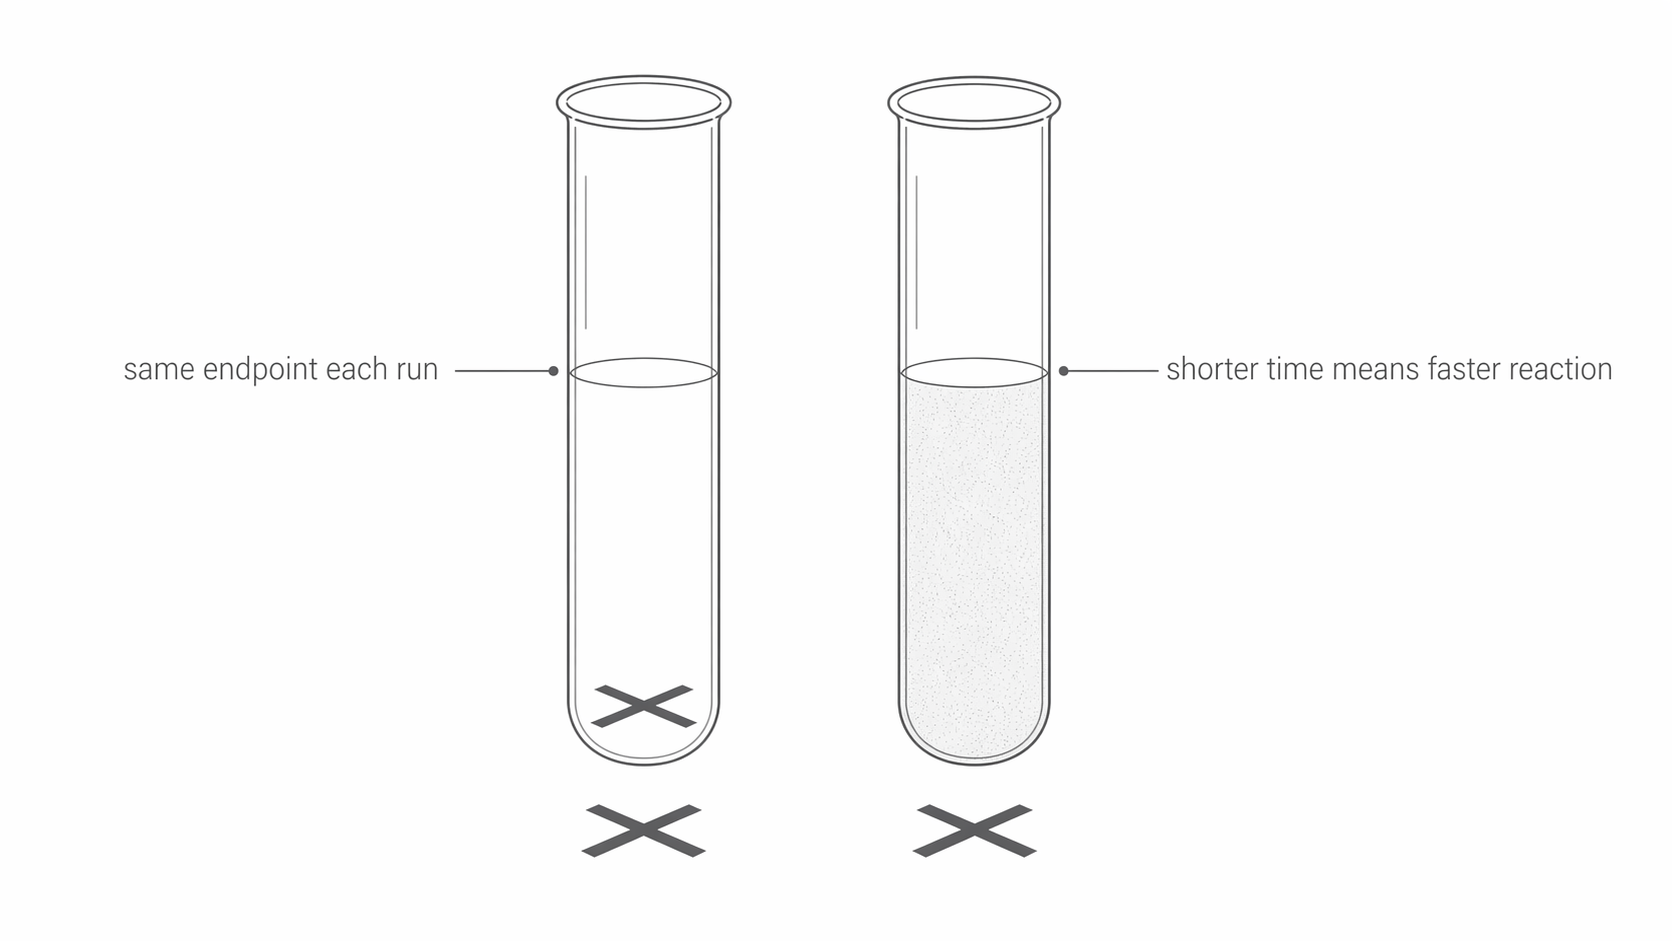
The key observation is the formation of solid sulfur. As sulfur particles appear, the mixture turns cloudy. If the reaction vessel is placed over a black cross, there comes a point when the cloudiness is great enough that the cross can no longer be seen from above. That visible end-point gives us a practical way to compare how quickly sulfur is being produced.
Initial rate
The initial rate is the rate of reaction measured right at the start, when reactant concentrations have changed very little from their starting values.
Strictly speaking, this practical does not measure the true initial rate directly. What it does is compare the time taken to reach the same visible end-point each time. Because the same depth of solution and the same visual standard are used, a shorter time means sulfur is being produced more quickly, so the reaction rate is greater.
Temperature is the independent variable. When temperature increases, particles in both solutions have more kinetic energy. That means collisions happen with greater energy, and a larger fraction of collisions have energy greater than or equal to the activation energy. The result is more successful collisions per second, so sulfur appears more quickly and the cross disappears sooner.
The diagram below shows how the disappearing-cross end-point is judged and why a shorter time means a faster reaction.
[DIAGRAM: asset_name: RP 03 - Investigation of How the Rate of a Reaction Changes with Temperature - Diagram 1; asset_slug: RP 03 - Investigation of How the Rate of a Reaction Changes with Temperature - Diagram 1; recommended_method: retained_png; description: Two identical boiling tubes standing over identical black crosses with the same liquid depth in each tube. The left tube is clear enough for the cross to be seen from above. The right tube is cloudy because sulfur has formed, so the cross is hidden at the judged end-point. Add labels "same endpoint each run" and "shorter time means faster reaction".]
Running the method fairly
To make this a fair test, you prepare the same reaction mixture each time and change only the temperature. A typical setup uses a measured volume of sodium thiosulfate solution in a tube placed over the cross, and a measured volume of hydrochloric acid in a second tube. Both tubes are placed in a warm water bath so they reach the chosen starting temperature before they are mixed.
Using a water bath matters because it heats the solutions more gently and evenly than a direct flame. It also matches the apparatus-and-technique requirement to use suitable heating equipment while still keeping the practical safe and controlled.
Control variable
A control variable is a factor kept the same so that any change in the result can be linked confidently to the independent variable.
In this experiment, the important control variables are the concentrations and volumes of both reactants, the total depth of liquid above the cross, the same viewing position, and the same end-point for "cross disappears". If one run used a deeper solution or a different volume, the cross might disappear later even if the chemistry had not changed, so the comparison would be unfair.
A careful sequence is:
- Measure the sodium thiosulfate solution into the tube above the cross.
- Measure the hydrochloric acid into a separate tube.
- Place both tubes in the water bath and allow them to reach the chosen temperature.
- Record the starting temperature.
- Mix the reactants, start the timer immediately, and look straight down from above.
- Stop the timer when the cross just disappears.
- Record the final temperature and use the mean of the initial and final readings as the best estimate of the reaction temperature.
- Repeat at several temperatures and repeat runs when needed.
The diagram below shows a suitable water-bath setup for carrying out the method fairly and recording the timing correctly.
[DIAGRAM: asset_name: RP 03 - Investigation of How the Rate of a Reaction Changes with Temperature - Diagram 2; asset_slug: RP 03 - Investigation of How the Rate of a Reaction Changes with Temperature - Diagram 2; recommended_method: retained_png; description: A rectangular plastic water bath with a flat lid holding two boiling tubes vertically. The left tube contains sodium thiosulfate solution, sits directly above a black cross, and has a thermometer in it. The right tube contains hydrochloric acid. Add a curved arrow showing the acid being poured into the thiosulfate tube, a stopwatch labelled "start timer immediately", and an eye above labelled "look vertically down from above".]
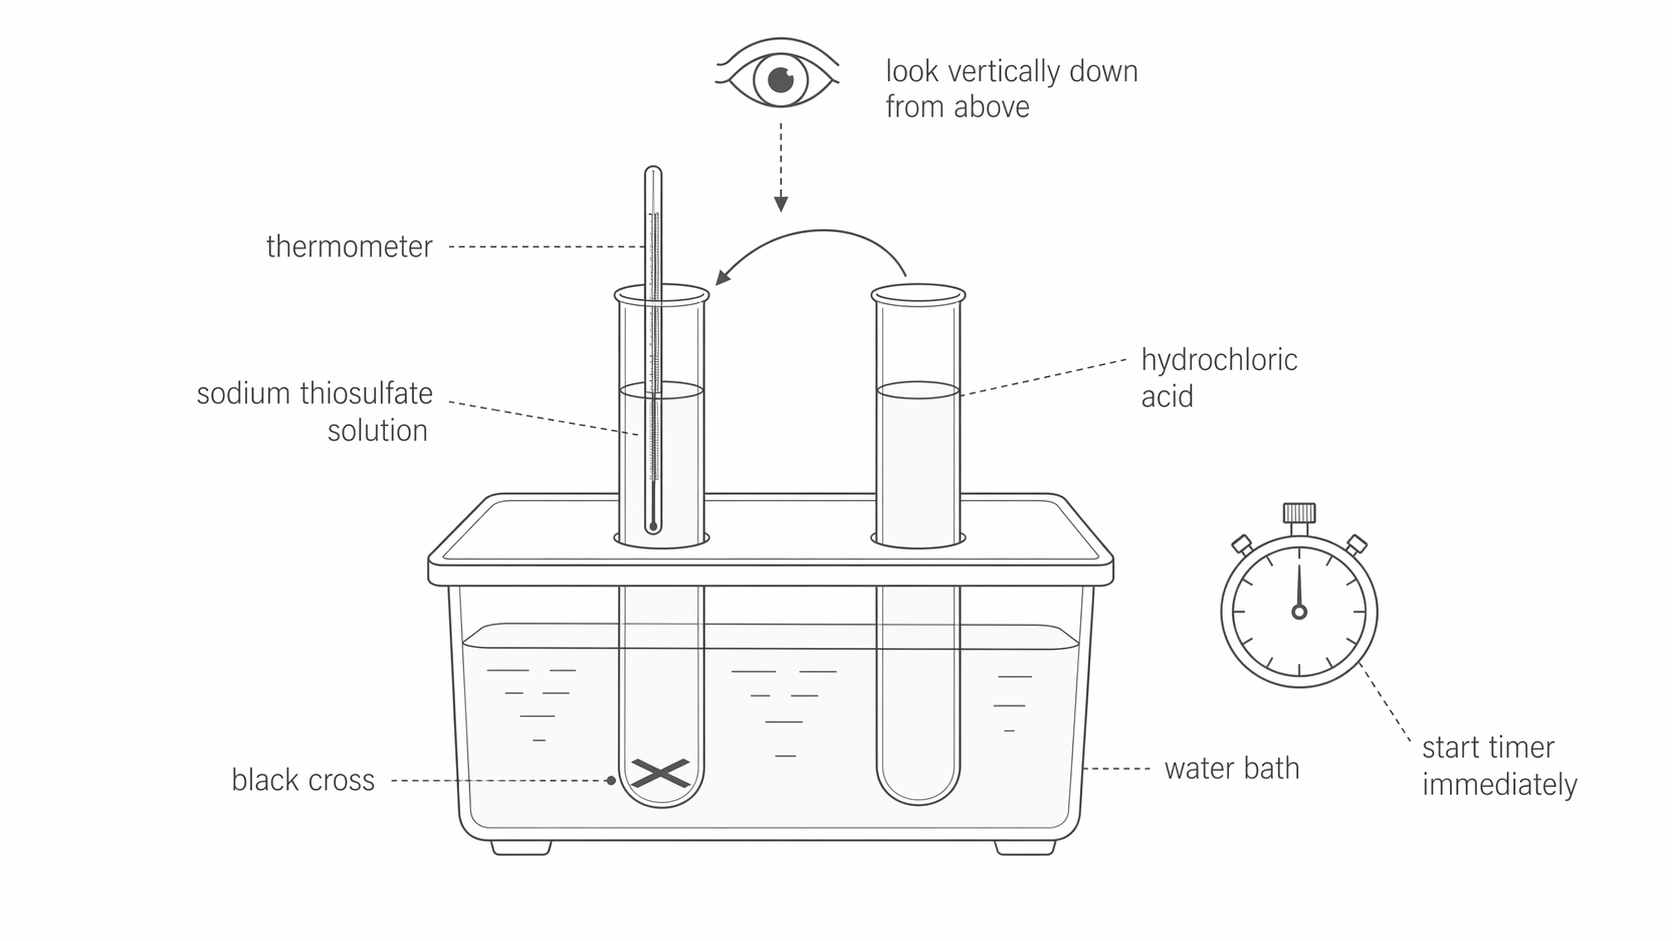
Measuring both initial and final temperature improves the method because the reaction mixture may warm or cool slightly during mixing and reaction. Using the mean temperature gives a better value for the temperature actually experienced by the reacting particles.
Safety is part of the chemistry, not an afterthought. Hydrochloric acid is irritant or corrosive depending on concentration, the reaction releases toxic sulfur dioxide, and hot water can cause burns. Goggles are essential, a lid or fume cupboard reduces sulfur dioxide escape, and waste can be emptied into a sodium carbonate stop bath to neutralise acid and dissolved sulfur dioxide.
Turning time into rate data
The clever part of this practical is the data handling. Each run is stopped when the same visible event happens: enough sulfur has formed to hide the cross. That means the amount of sulfur at the end-point is treated as fixed, so the rate is proportional to:
Rate proxy for the disappearing cross method
Here, t is the time in seconds for the cross to disappear. A smaller t gives a larger value of 1/t, which represents a faster reaction.
Worked example: suppose the cross disappears in 80 s at 25 degrees C and in 40 s at 35 degrees C.
- at
25 degrees C,1/t = 1/80 = 0.0125 s^-1 - at
35 degrees C,1/t = 1/40 = 0.0250 s^-1
The second value is twice as large, so the reaction is proceeding about twice as fast at the higher temperature under those conditions.
This is why tables and graphs for this practical often use either time or 1/t. If you plot time against temperature, the graph usually slopes downward because time gets shorter. If you plot 1/t against temperature, the graph rises because the rate proxy increases.
The diagram below compares the two common ways of plotting the results from this practical.
[DIAGRAM: asset_name: RP 03 - Investigation of How the Rate of a Reaction Changes with Temperature - Diagram 3; asset_slug: RP 03 - Investigation of How the Rate of a Reaction Changes with Temperature - Diagram 3; recommended_method: retained_png; description: Two simple graphs side by side with temperature / degrees C on the x-axis for both. Left graph: y-axis time / s, with a smooth downward trend as temperature increases. Right graph: y-axis 1/t / s^-1, with a smooth upward trend as temperature increases. Add a short note that 1/t is easier to interpret as a rate proxy.]
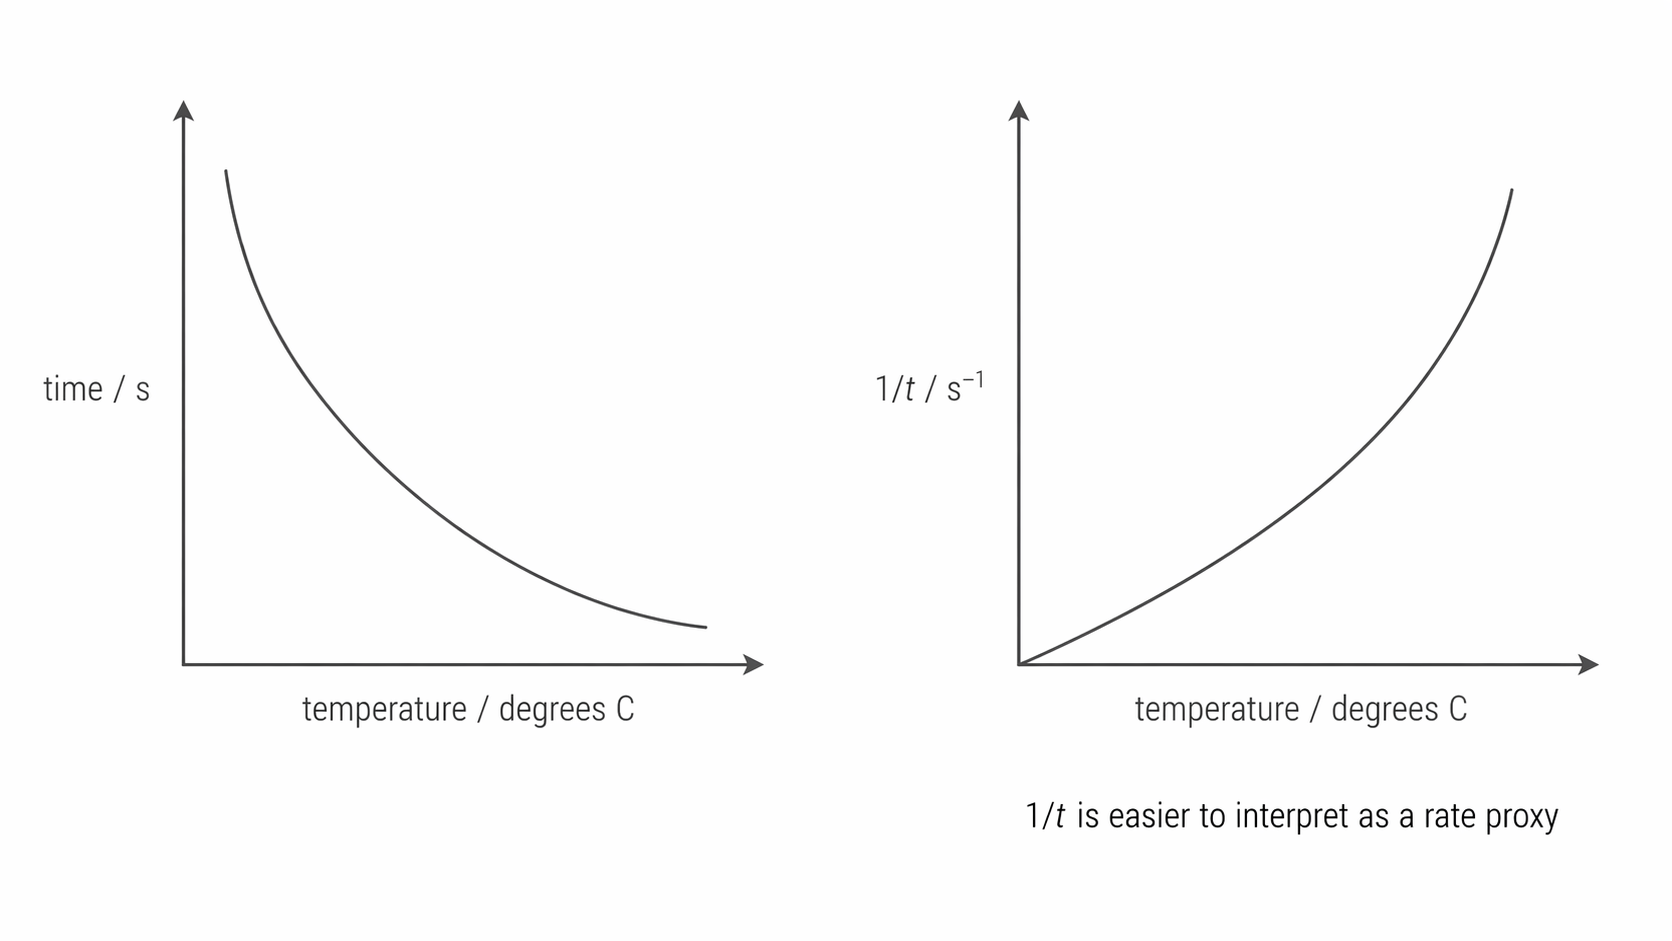
One subtle but important point is that 1/t is an approximation, not a perfect rate measurement. The disappearing cross method assumes that the cross disappears when a fixed amount of sulfur has formed and that this threshold is judged consistently. That is good enough for school kinetics work, but it also explains why repeat results and careful technique matter.
Reliability, errors, and higher-level analysis
The largest uncertainty in this practical is usually the end-point. Different students may decide the cross has disappeared at slightly different moments, and even the same student may not judge it identically every time. There is also a short delay between mixing the reactants and starting the timer, and the temperature may drift if the tubes are not left in the water bath for long enough before mixing.
Simply saying "human error" does not tell you much. The real value comes from identifying the source of uncertainty and explaining how to reduce it. Using the same observer throughout improves consistency. Viewing from directly above keeps the path length through the liquid the same. Repeating each temperature and calculating a mean reduces the effect of random error. A thermostatically controlled water bath is better than estimating temperature with hot tap water because it holds the temperature steady. Using a light sensor or colorimeter would reduce subjective judgement even further, although the classic required practical uses the visible cross.
Activation energy
Activation energy is the minimum energy that colliding particles must have for a reaction to occur.
This definition explains the temperature effect at particle level. A higher temperature does not lower the activation energy. Instead, it increases the fraction of particles with energy greater than or equal to that activation energy, so there are more successful collisions each second.
At the higher end of A-level chemistry, these results can be analysed further. If 1/t is treated as proportional to the rate constant k, then plotting ln(1/t) against 1/T in kelvin gives a straight line with gradient -Ea/R, where R = 8.31 J mol^-1 K^-1. That lets you estimate the activation energy from practical data rather than only describing the trend.
The diagram below shows the straight-line plot used in the higher-level analysis of this practical.
[DIAGRAM: asset_name: RP 03 - Investigation of How the Rate of a Reaction Changes with Temperature - Diagram 4; asset_slug: RP 03 - Investigation of How the Rate of a Reaction Changes with Temperature - Diagram 4; recommended_method: retained_png; description: A straight-line graph with y-axis labelled ln(1/t) and x-axis labelled 1/T (K^-1). The line slopes downward from left to right. Mark the gradient on the line as -Ea/R and add a note that T is measured in kelvin.]
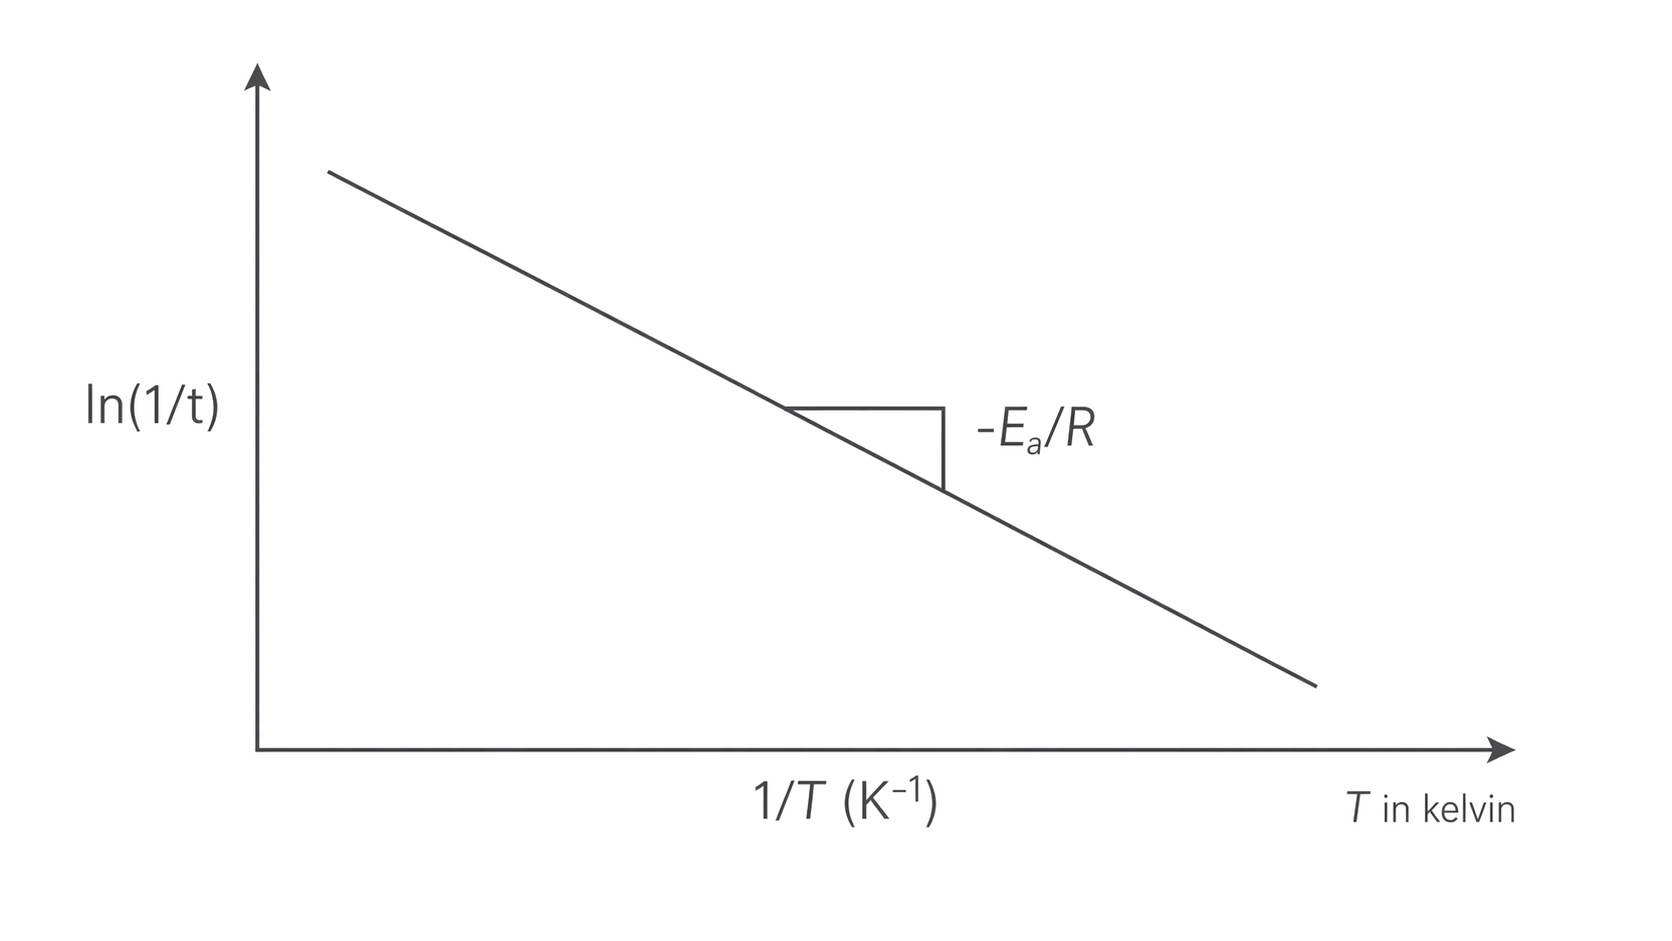
The core practical conclusion is simpler than that extension: when temperature increases, the time for the cross to disappear decreases, so the rate increases. A sound interpretation connects that observation to a fair method, clear control of variables, sensible safety measures, and data handling that uses 1/t carefully rather than blindly.