RP02 - Measurement of an Enthalpy Change
Calorimetry is how chemists estimate an enthalpy change from a temperature change. In this required practical, you need to turn measurements of mass, volume, and temperature into a value for ΔH in kJ mol^-1, then judge how trustworthy that value is. The same core ideas apply whether you are dissolving a salt, neutralising an acid with an alkali, carrying out a displacement reaction, or burning an alcohol.
Energy transfer and the meaning of ΔH
At constant pressure, an enthalpy change tells us how much heat energy is transferred during a reaction. A calorimeter does not measure the reaction's energy directly. Instead, it measures how much the surroundings warm up or cool down, and we infer the reaction's enthalpy change from that.
Enthalpy change
The heat energy transferred in a reaction at constant pressure.
If the temperature of the solution or water increases, the surroundings have gained energy. That means the reaction released energy, so the reaction is exothermic and ΔH is negative. If the temperature falls, the surroundings have lost energy to the reaction. That means the reaction is endothermic and ΔH is positive.
To turn that temperature change into an enthalpy change, you need one equation for the surroundings and one for the reaction itself.
Core calorimetry equations
In these equations:
qis the energy transferred to or from the surroundings in joules,Jmis the mass of the water or solution in grams,gcis the specific heat capacity, usually taken as4.18 J g^-1 K^-1for water or dilute aqueous solutionsΔTis the temperature change indegrees CorKnis the amount reacting, in moles, for the process you are finding
The minus sign matters. The calorimeter tells you the energy change of the surroundings, but ΔH is for the reaction. If the surroundings gain +1250 J, the reaction itself has changed by -1250 J.
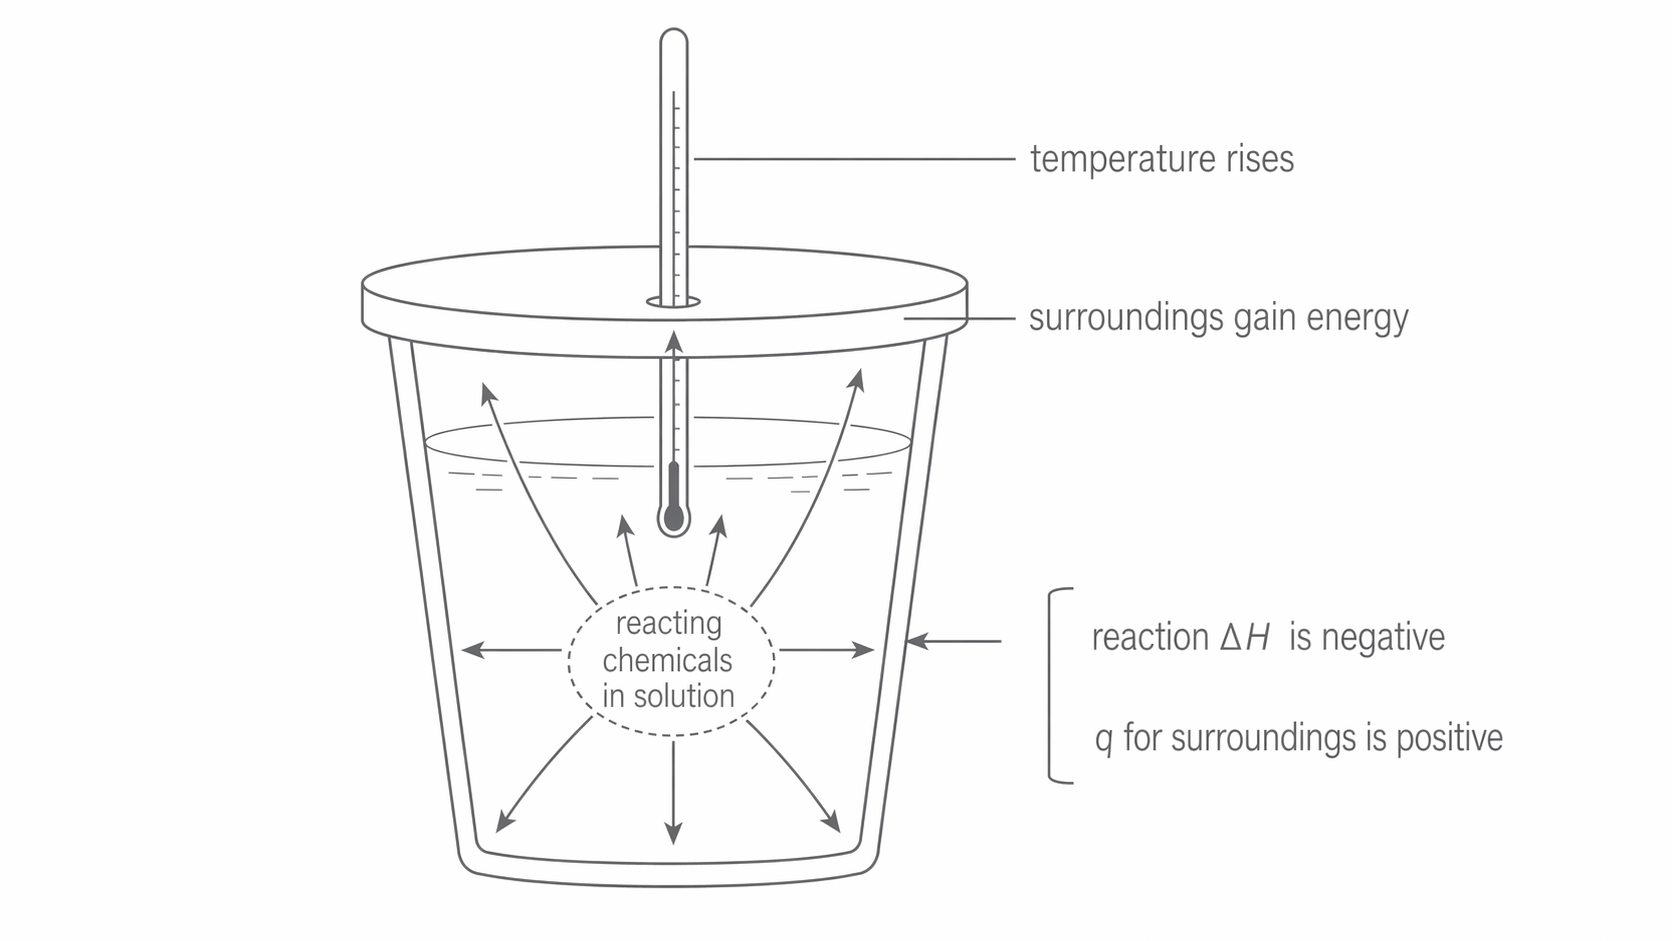
The diagram below shows the energy flow in an exothermic calorimetry experiment and makes the sign convention easier to see.
[DIAGRAM: asset_name: RP 02 - Measurement of an Enthalpy Change - Diagram 1; asset_slug: RP 02 - Measurement of an Enthalpy Change - Diagram 1; recommended_method: retained_png; description: Monochrome energy-flow diagram of an exothermic cup calorimetry experiment, with reacting chemicals in solution at the centre and arrows out to the surrounding solution, thermometer, lid, and cup. Label "temperature rises", "surroundings gain energy", "q for surroundings is positive", and "reaction ΔH is negative".]
Suppose 50.0 g of solution warms by 4.0 degrees C. Then:
q = 50.0 x 4.18 x 4.0 = 836 J
That +836 J belongs to the surroundings. The reaction's energy change for that sample is therefore -836 J.
This is exactly where sign errors creep in most often. It is easy to calculate q correctly for the surroundings and then forget that the reaction itself has the opposite sign.
Measuring ΔH for reactions in solution
Many enthalpy-change experiments use a simple solution calorimeter: a polystyrene cup placed in a beaker, with a lid, thermometer, and stirrer. This is suitable for dissolution reactions such as potassium chloride or sodium carbonate in water, neutralisation such as HCl(aq) + NaOH(aq), and displacement reactions such as zinc with copper(II) sulfate solution.
Calorimetry
A method for determining an enthalpy change by measuring the temperature change caused by energy transfer during a reaction.
For a typical solution experiment, the key sequence is:
- measure a known volume of liquid, or known volumes of two solutions
- record the initial temperature, or the mean initial temperature if two solutions are being mixed
- add the second reactant quickly
- stir so the temperature is even throughout the cup
- record the highest temperature for an exothermic change or the lowest temperature for an endothermic change
Polystyrene is used because it is a good thermal insulator, so less energy is exchanged with the surroundings. A lid helps for the same reason. Stirring matters because you want one uniform temperature in the whole solution, not a warm layer near the reaction site and a cooler layer elsewhere.
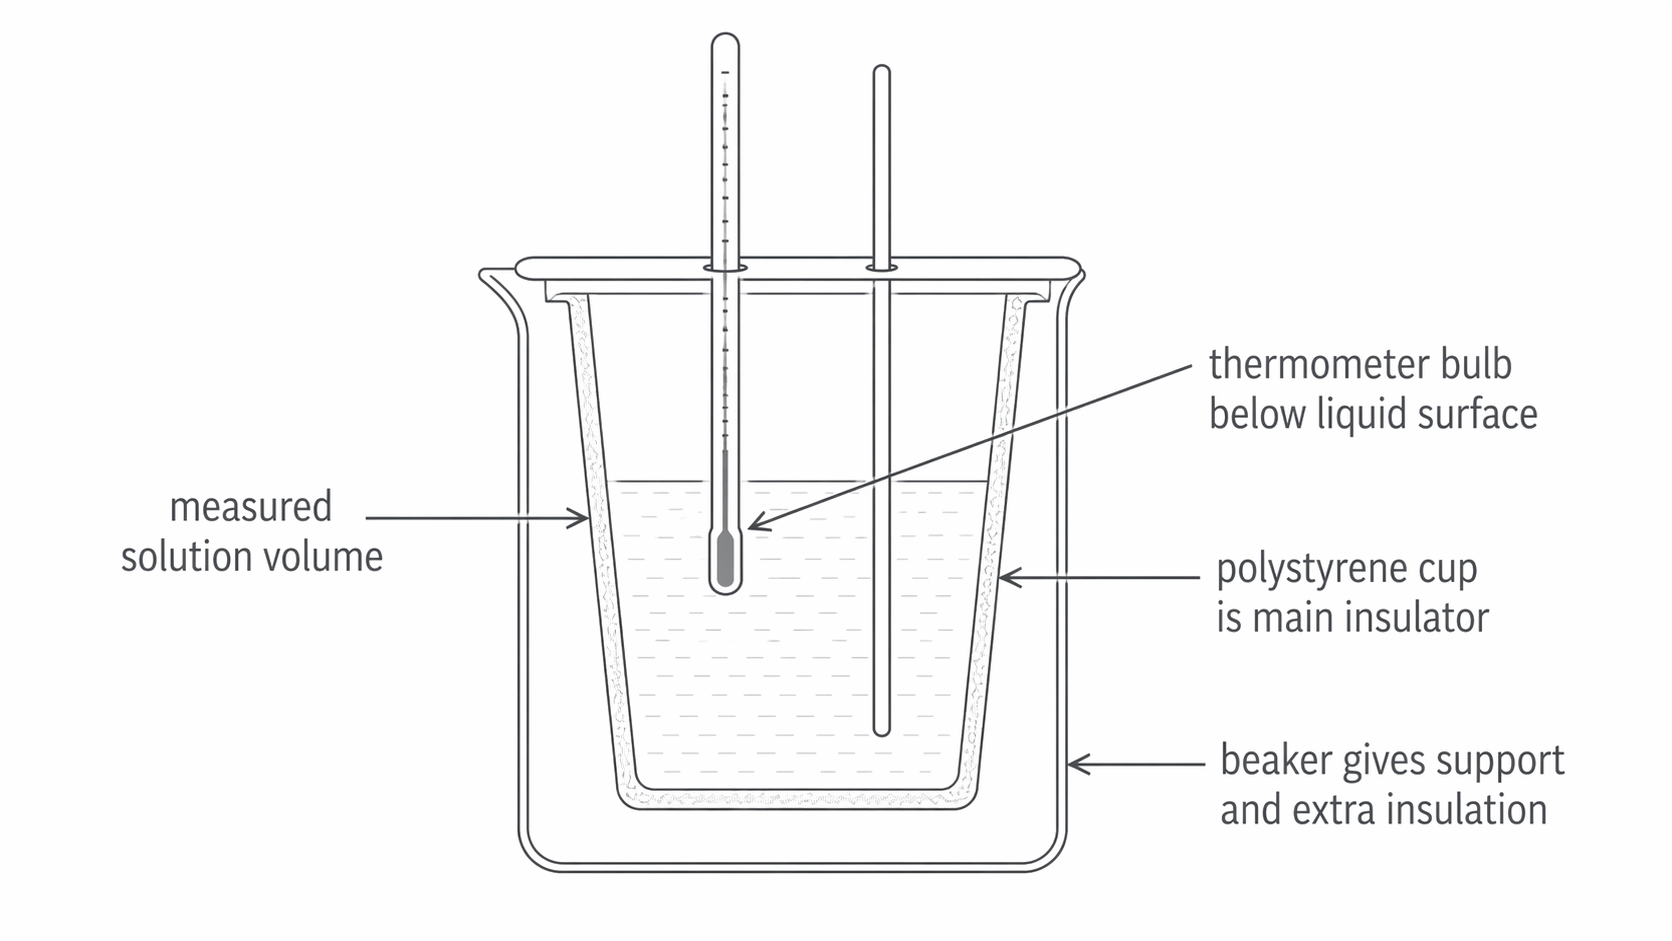
The diagram below shows the basic polystyrene-cup setup used for solution enthalpy measurements.
[DIAGRAM: asset_name: RP 02 - Measurement of an Enthalpy Change - Diagram 2; asset_slug: RP 02 - Measurement of an Enthalpy Change - Diagram 2; recommended_method: retained_png; description: Monochrome cross-section of a polystyrene cup calorimeter inside a supporting beaker, with lid, thermometer, stirrer, and measured solution volume. Label the thermometer bulb below the liquid surface, the polystyrene cup as the main insulator, and the beaker as support with extra insulation.]
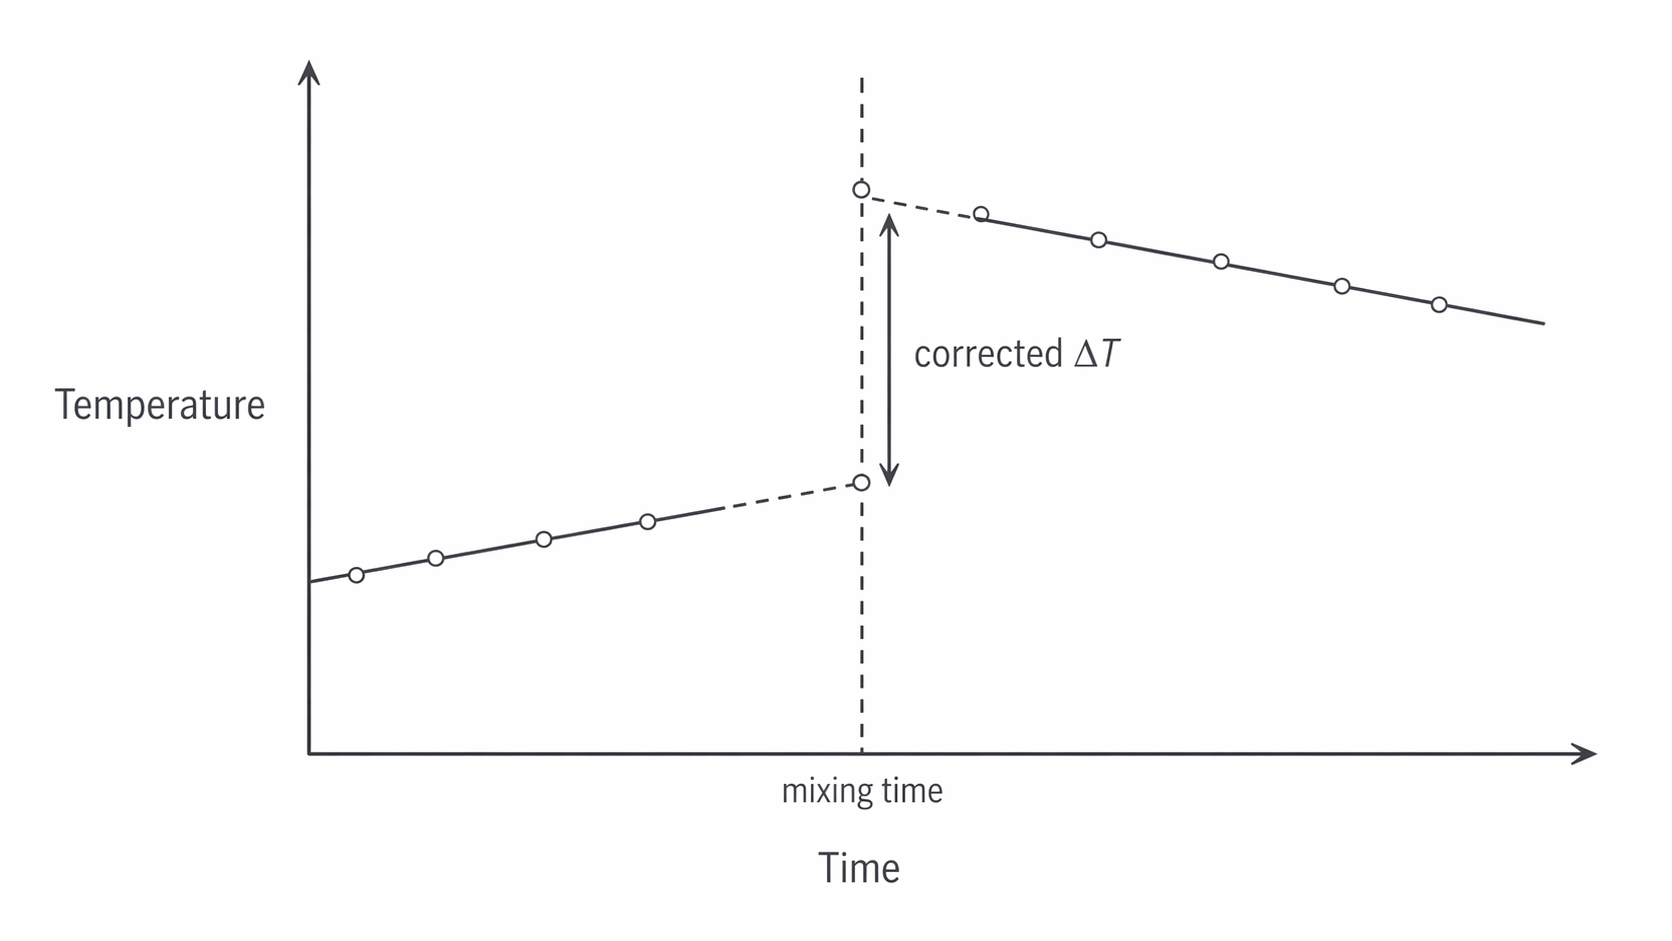
If a solid is added and the temperature changes over a longer time, a single maximum or minimum may not be reliable because heat is already being lost or gained while the reaction is happening. In that case, you can record temperatures before and after mixing, plot temperature against time, draw best-fit lines, and extrapolate both lines back to the mixing time. The gap between the lines at that moment gives a better estimate of the true ΔT.
The diagram below shows how the corrected temperature change is taken from the vertical gap between the extrapolated lines at the mixing time.
[DIAGRAM: asset_name: RP 02 - Measurement of an Enthalpy Change - Diagram 3; asset_slug: RP 02 - Measurement of an Enthalpy Change - Diagram 3; recommended_method: retained_png; description: Monochrome temperature-against-time graph for a calorimetry experiment, with one best-fit line before mixing and one after mixing, both extrapolated to a vertical mixing-time marker. Show the vertical gap at the mixing time labelled as the corrected ΔT.]
In the required practical, the sign of ΔT depends on the chemistry:
- dissolving
KClis typically endothermic, so the temperature falls - neutralising a strong acid with a strong alkali is exothermic, so the temperature rises
- many metal displacement reactions are exothermic, so the temperature rises
Safety depends on the reactants. Acids and alkalis can be corrosive, copper(II) sulfate solution should not contact skin unnecessarily, and alcohols used in combustion experiments are flammable, so goggles and careful handling are essential.
Converting temperature data into ΔH
Once you have a temperature change, the rest of the calculation should follow the same structure every time.
Limiting reagent
The reactant that is completely used up first and therefore determines how much reaction can occur.
For solution calorimetry, you usually make two practical assumptions:
- dilute aqueous solutions have density close to
1.00 g cm^-3, so100 cm^3has a mass of about100 g - the solution has the same specific heat capacity as water, so
c = 4.18 J g^-1 K^-1
Worked example:
50.0 cm^3 of 1.00 mol dm^-3 HCl is mixed with 50.0 cm^3 of 1.00 mol dm^-3 NaOH. The temperature rises by 5.8 degrees C.
Step 1: Find the mass of solution.
Total volume = 100.0 cm^3, so mass ≈ 100.0 g
Step 2: Find q for the surroundings.
q = mcΔT = 100.0 x 4.18 x 5.8 = 2424 J
Step 3: Change the sign for the reaction.
Reaction energy change for this sample = -2424 J = -2.424 kJ
Step 4: Divide by the amount reacting.
Moles of HCl = 1.00 x 50.0 / 1000 = 0.0500 mol
Moles of NaOH = 0.0500 mol
So 0.0500 mol reacts.
Step 5: Calculate ΔH.
ΔH = -2.424 / 0.0500 = -48.5 kJ mol^-1
That value is negative because the neutralisation warmed the surroundings. By contrast, if a salt such as KCl cools the water, ΔT is negative for the surroundings and the final ΔH becomes positive.
Three details matter here: converting cm^3 to dm^3 when finding moles, using the total mass of solution rather than the mass of one portion, and switching the sign when converting from q for the surroundings to ΔH for the reaction.
Combustion calorimetry, errors, and improvements
For the combustion of an alcohol, the setup changes but the logic stays the same. A known mass or volume of water is heated by a spirit burner containing the alcohol. You measure the temperature rise of the water and the mass of alcohol burned, then use q = mcΔT for the water and divide by the moles of fuel burned.
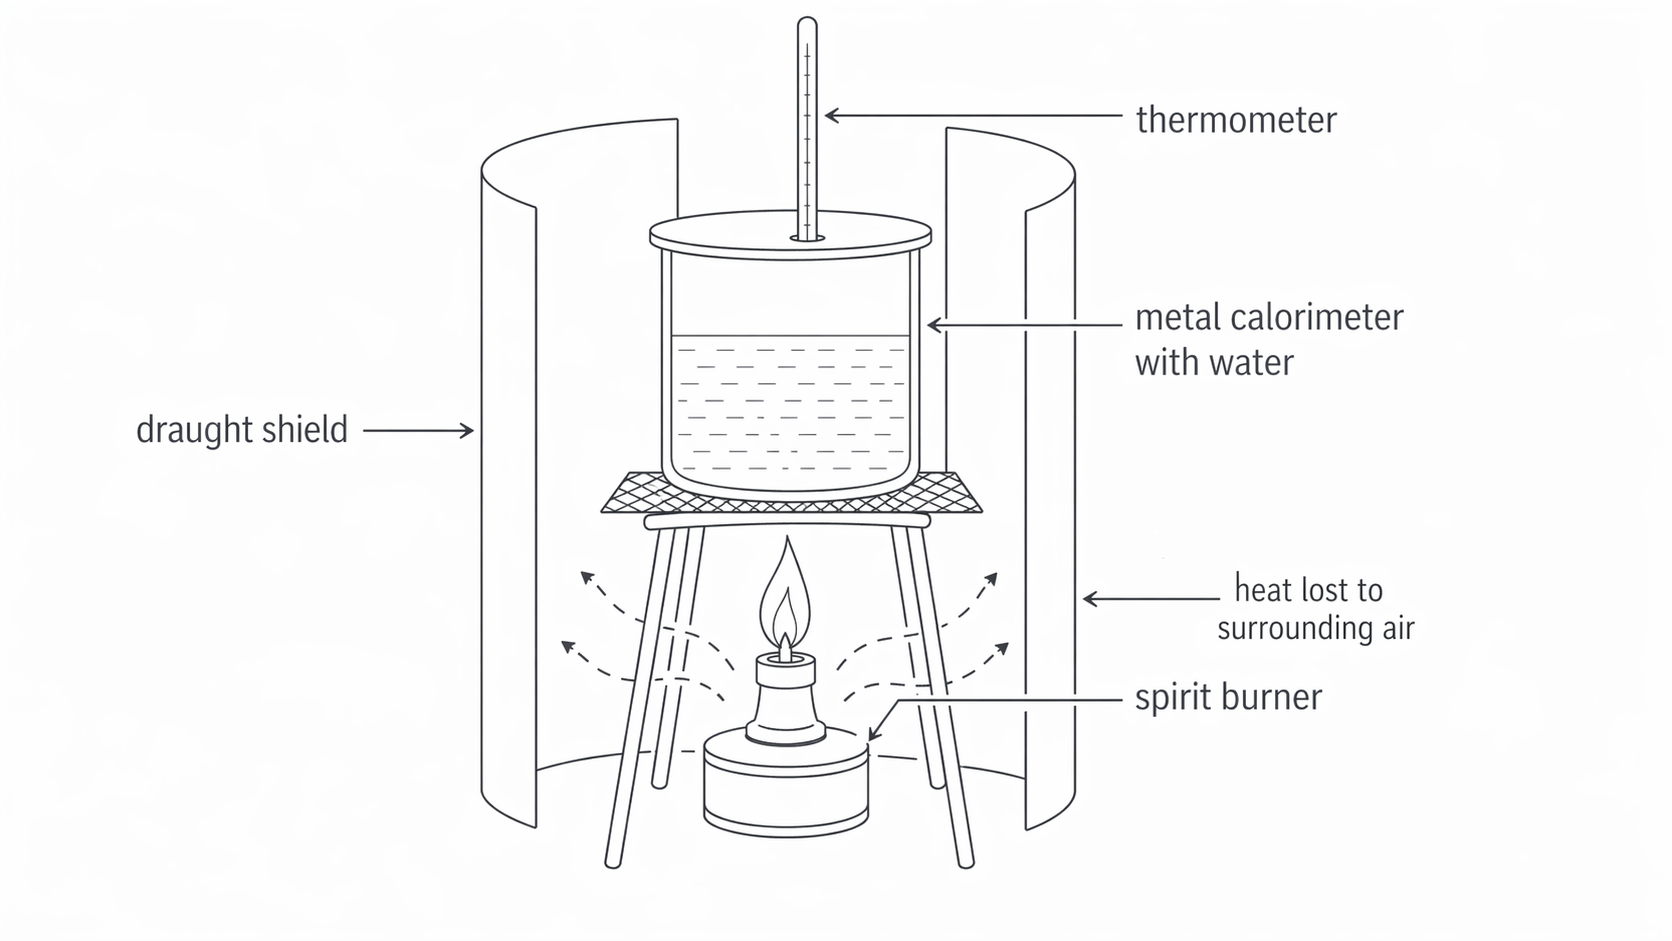
The diagram below shows the typical combustion calorimetry arrangement with a spirit burner, metal can, and draught shield.
[DIAGRAM: asset_name: RP 02 - Measurement of an Enthalpy Change - Diagram 4; asset_slug: RP 02 - Measurement of an Enthalpy Change - Diagram 4; recommended_method: retained_png; description: Monochrome combustion calorimetry setup with a spirit burner heating a metal calorimeter or copper can containing water, with lid, thermometer, support stand, and draught shield. Add arrows showing heat lost from the flame region to the surrounding air.]
The basic sequence is:
- weigh the spirit burner and fuel before heating
- heat a known mass of water
- record the water temperature rise
- reweigh the burner to find the mass of alcohol burned
- convert mass burned to moles, then calculate
ΔHinkJ mol^-1
In practice, experimentally determined enthalpies of combustion are usually less exothermic than accepted values. That is because much of the energy released does not end up in the water.
Major sources of error include:
- heat loss from the flame, cup, and water to the surroundings
- incomplete combustion, which produces
COor soot instead of fully formingCO2 - energy absorbed by the apparatus itself
- evaporation of fuel from the spirit burner between weighings
- assuming all aqueous mixtures behave exactly like water
- delayed readings, so the true peak or lowest temperature is missed
Better methods reduce these problems. A lid and draught shield reduce heat loss. A temperature probe with data logging gives a more reliable temperature-time graph. A flame calorimeter with a copper spiral chimney and an enclosed flame channels more energy into the water. Burning the fuel in pure oxygen also makes combustion more complete.
The big picture is simple: calorimetry is about careful measurement, sensible assumptions, and honest evaluation. The chemistry comes from tracking where the energy went, choosing the correct mass and amount reacting, and interpreting the sign of ΔH correctly.