6.3 - 6.4 - Limiting factors
Explain how light intensity, carbon dioxide and temperature limit photosynthesis, and interpret patterns in rate data. Higher learners also use changes in several conditions to identify shifting limiting factors.
6.3 - One limiting factor at a time
Photosynthesis uses light energy to convert carbon dioxide and water into glucose and oxygen. More glucose made in a given time can supply more material for growth.
The rate of photosynthesis is how much photosynthesis occurs per unit time. It may be represented by the amount of glucose made or oxygen produced per unit time. A limiting factor is an environmental condition whose current value prevents the rate from being faster. Changing that factor towards a more favourable value raises the rate only until another factor becomes limiting.
| Factor | Effect on rate while it is limiting | Causal explanation | What happens next |
|---|---|---|---|
| Light intensity | Increasing light intensity increases the rate. | More light energy is available to drive photosynthesis. | The curve plateaus when light is no longer limiting and another factor restricts the rate. |
| Carbon dioxide concentration | Increasing carbon dioxide concentration increases the rate. | Carbon dioxide is a reactant, so more is available for the reactions that make glucose. | The curve plateaus when carbon dioxide is no longer limiting. |
| Temperature | Below the optimum, increasing temperature increases the rate. | Photosynthesis includes enzyme-controlled reactions. Greater kinetic energy causes more frequent successful collisions between enzymes and substrates. | At the optimum the rate is greatest under those conditions. Above the optimum, enzymes denature, their active sites change shape, and the rate decreases. |
Low temperature does not usually denature the enzymes: it slows their activity. There is also no single optimum temperature for every photosynthetic organism, so a graph should be interpreted from the information supplied rather than from a memorised universal value.
[DIAGRAM: asset_name: 6.1-6.4 - Photosynthesis and limiting factors - diagram 01; asset_slug: edexcel-gcse-biology-6-1-6-4-limiting-factor-curves; recommended_method: matplotlib; description: Create one clean three-panel deterministic conceptual graph, explicitly captioned as relationships rather than experimental data. Every panel has the vertical axis 'rate of photosynthesis / relative units'. Panel A has horizontal axis 'light intensity / relative units' and a curve that rises from zero then plateaus; label the rising region 'light limiting' and the plateau 'another factor limiting'. Panel B has horizontal axis 'carbon dioxide concentration / relative units' and a curve that rises from zero then plateaus; label the equivalent limiting regions. Panel C has horizontal axis 'temperature / degrees C' and a curve that rises to one labelled 'optimum temperature' then falls steeply, with brief labels 'enzyme-controlled rate increases' on the rise and 'enzymes denature' on the fall. Use smooth schematic curves with no plotted experimental points, no invented numerical optimum, and no implication that all species share one optimum. Exclude water, minerals, wavelength, chloroplast stages, lamp distance, practical apparatus, inverse-square relationships, compensation point, respiration and photoinhibition.]
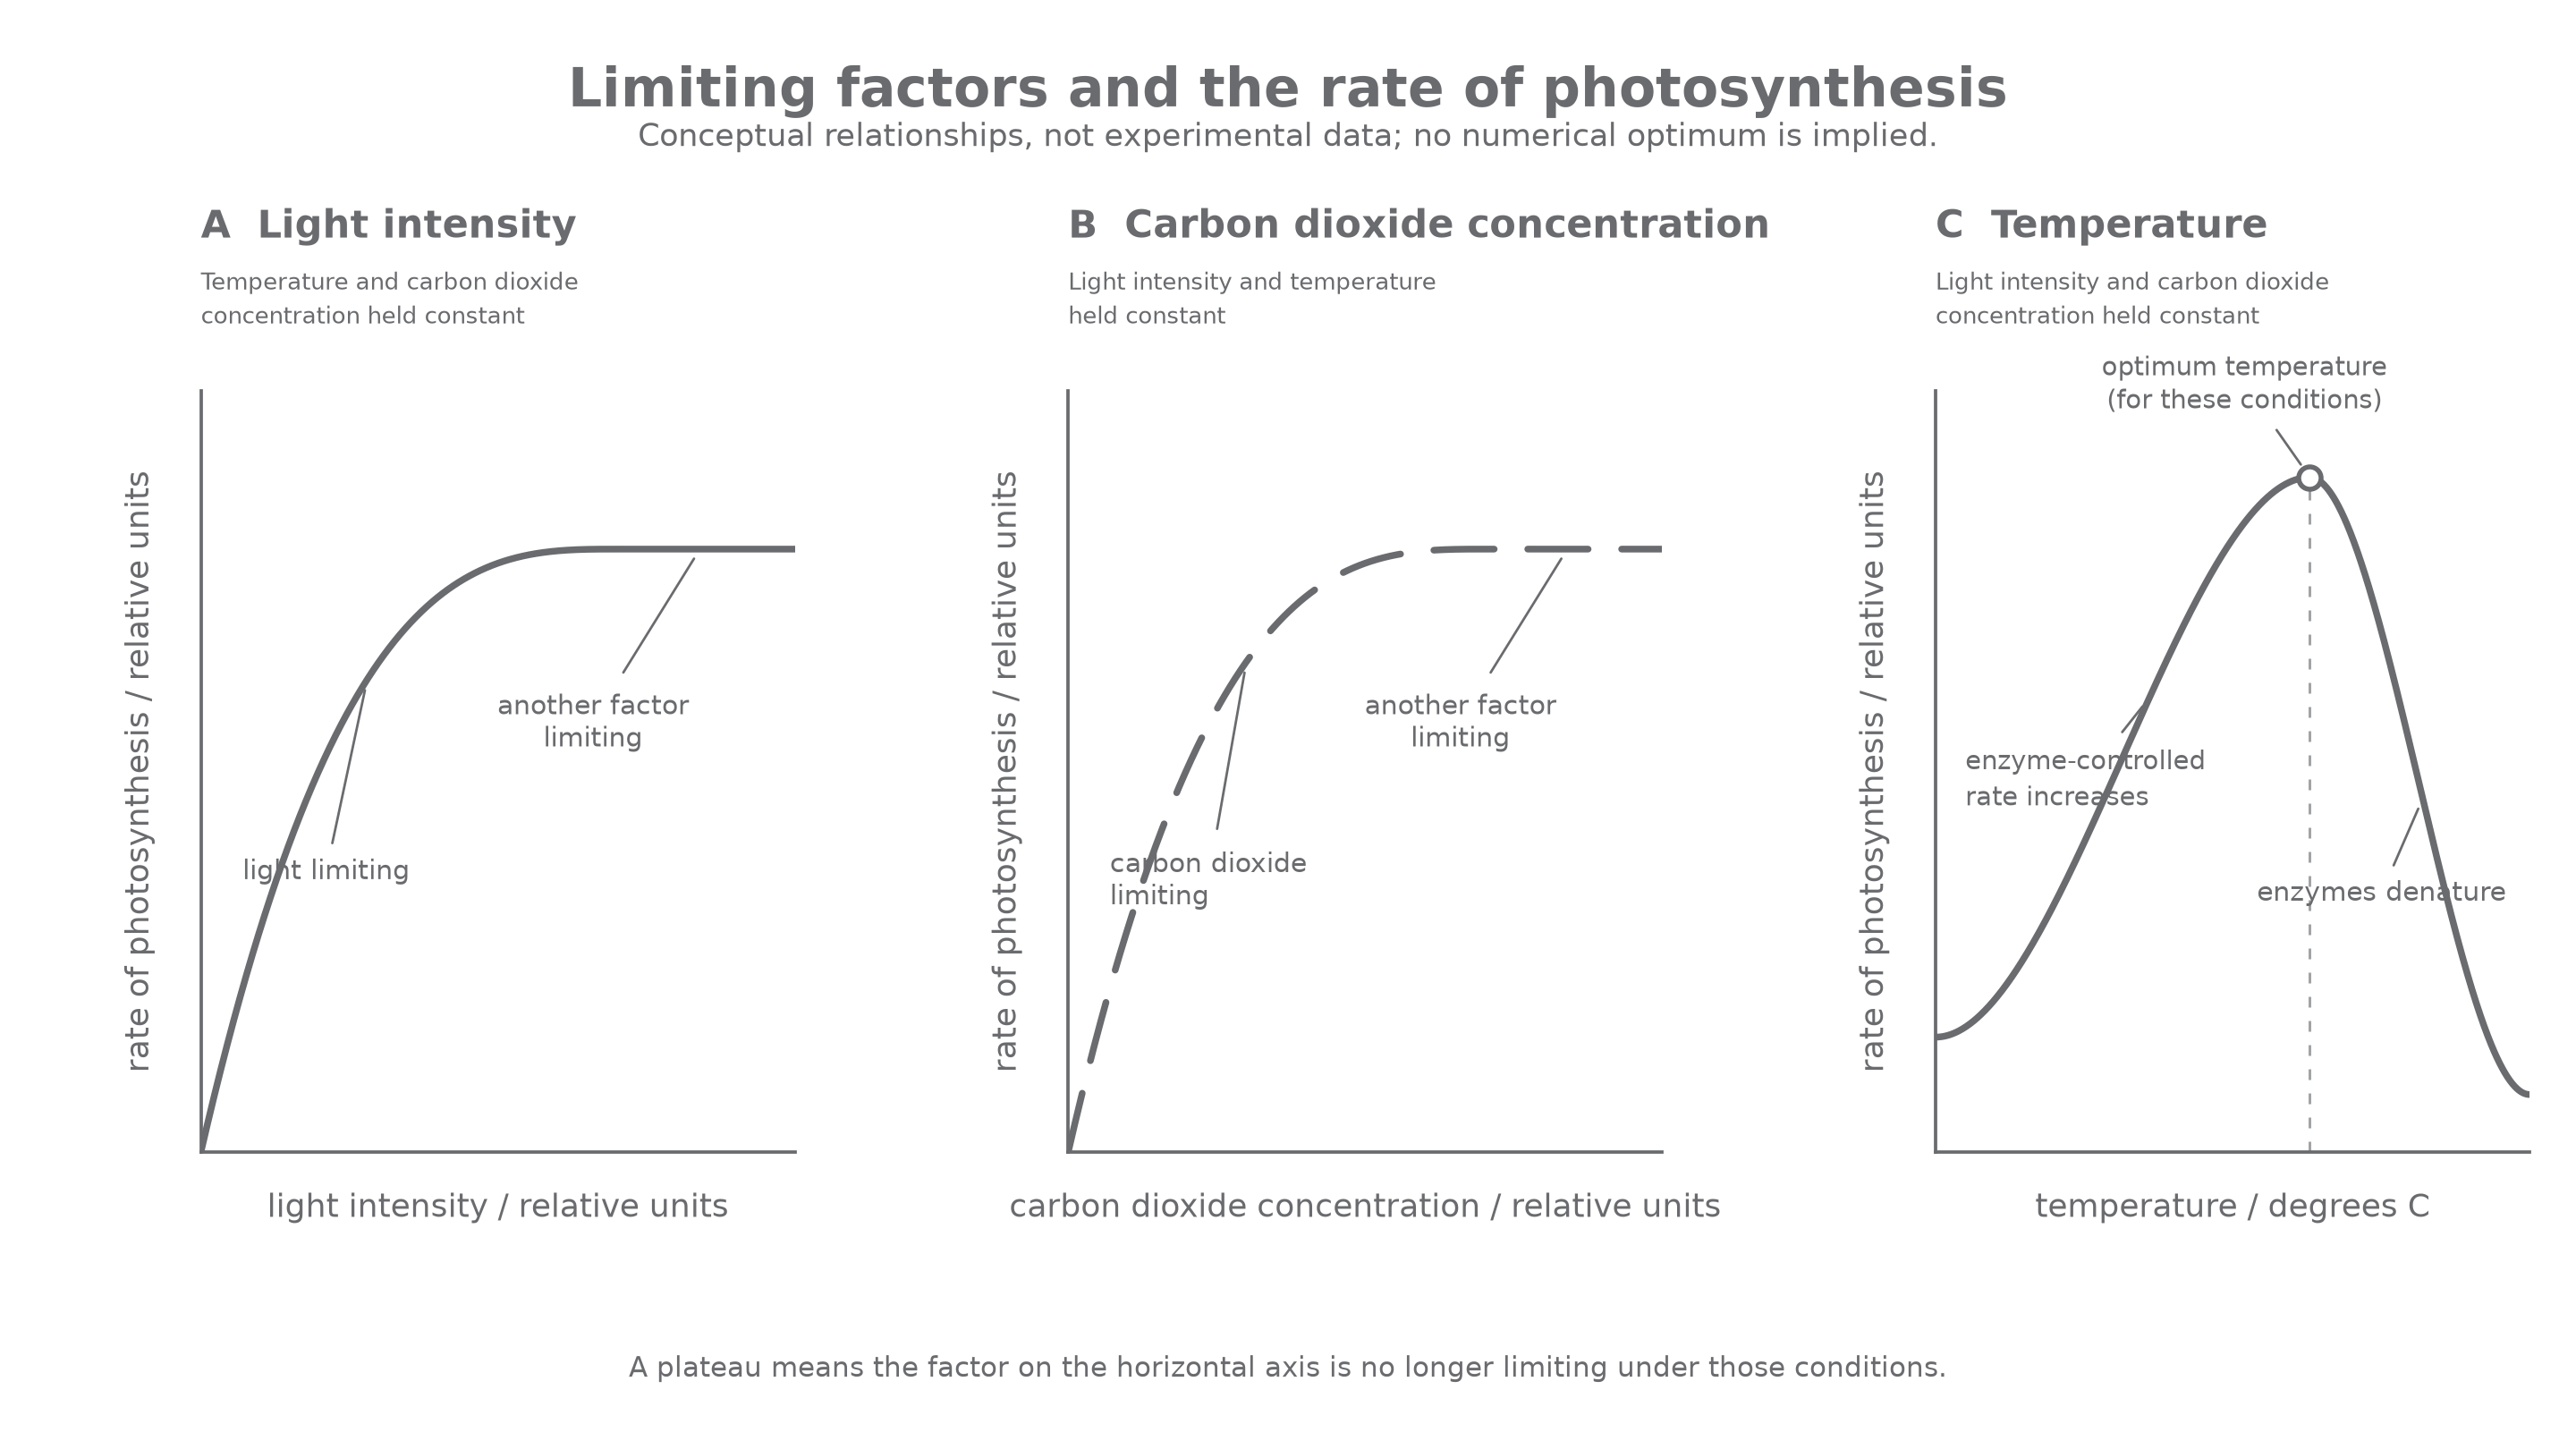
A plateau means that increasing the factor on the horizontal axis no longer increases the rate under those conditions. It does not mean the plant has an unchangeable maximum rate.
6.3 - Interpreting rate patterns
A strong graph or table explanation separates what the values show from why the pattern occurs. First identify the changed factor and the rate. Then describe the direction using values, locate any plateau or optimum, and finally explain the pattern using the limiting-factor mechanism.
Worked example
An alga is kept at constant temperature and carbon dioxide concentration.
| Light intensity / relative units | 20 | 40 | 60 | 80 |
|---|---|---|---|---|
| Rate of photosynthesis / relative units | 2 | 5 | 7 | 7 |
From 20 to 60 relative units of light intensity, the rate increases from 2 to 7 relative units, so light is limiting over this range. From 60 to 80 relative units, the rate remains at 7: this is a plateau. Light is no longer limiting there, so increasing light alone cannot increase the rate; carbon dioxide concentration or temperature must now be restricting it.
Notice the precision of the reasoning. "The rate goes up and then stops" describes the shape vaguely. The worked explanation identifies both variables, quotes paired values, names the plateau and connects it to a change in the limiting factor.
Continue this lesson.
You’re previewing NovaLearn without an account. Create a free account to read the rest.
Create free account