Appendix 4 - Maps, coordinates and landscape evidence
Learn to locate places precisely and use maps, sketches and photographs as evidence. These Appendix 4 skills help you describe a landscape before proposing an explanation for it.
Patterns at different scales
A map selects features of a place and represents their positions using symbols. Read its title, date, key, scale and orientation before interpreting its pattern. A blue line may represent a river, but colour has meaning only through the key. An atlas combines maps at different scales: a world map can show a broad concentration of settlements near coasts, whereas a street map can show individual roads and buildings.
Describe a distribution by locating concentrations, gaps and exceptions. “Most settlements are in the eastern lowland, with a smaller group beside the western road” communicates more than “they are uneven”. Quote a coordinate, named region or distance where it helps someone locate the pattern. Compare the same type of feature at the same scale before claiming one area is more densely occupied.
Vegetation, farmland, transport routes and settlement can form associated patterns. Buildings beside a road may suggest access influenced their location. The map shows their association; it does not prove which came first. A road may have been built to serve an existing settlement. A land-use map also records categories chosen by its author: mixed residential and commercial activity can disappear inside one “urban” class.
Locating and measuring features
Coordinates give a position rather than a description of its appearance. On a rectangular grid read eastings first, then northings: move across, then up. A four-figure grid reference identifies a square by its south-west corner. For a six-figure reference, estimate tenths across and up within that square: a point 0.4 across square 21 and 0.6 up square 40 is 214406. This convention assumes the map supplies the appropriate numbered grid; do not turn every local coordinate into an OS reference. Latitude is north/south of the Equator; longitude is east/west of the prime meridian. State their order explicitly when recording digital coordinates.
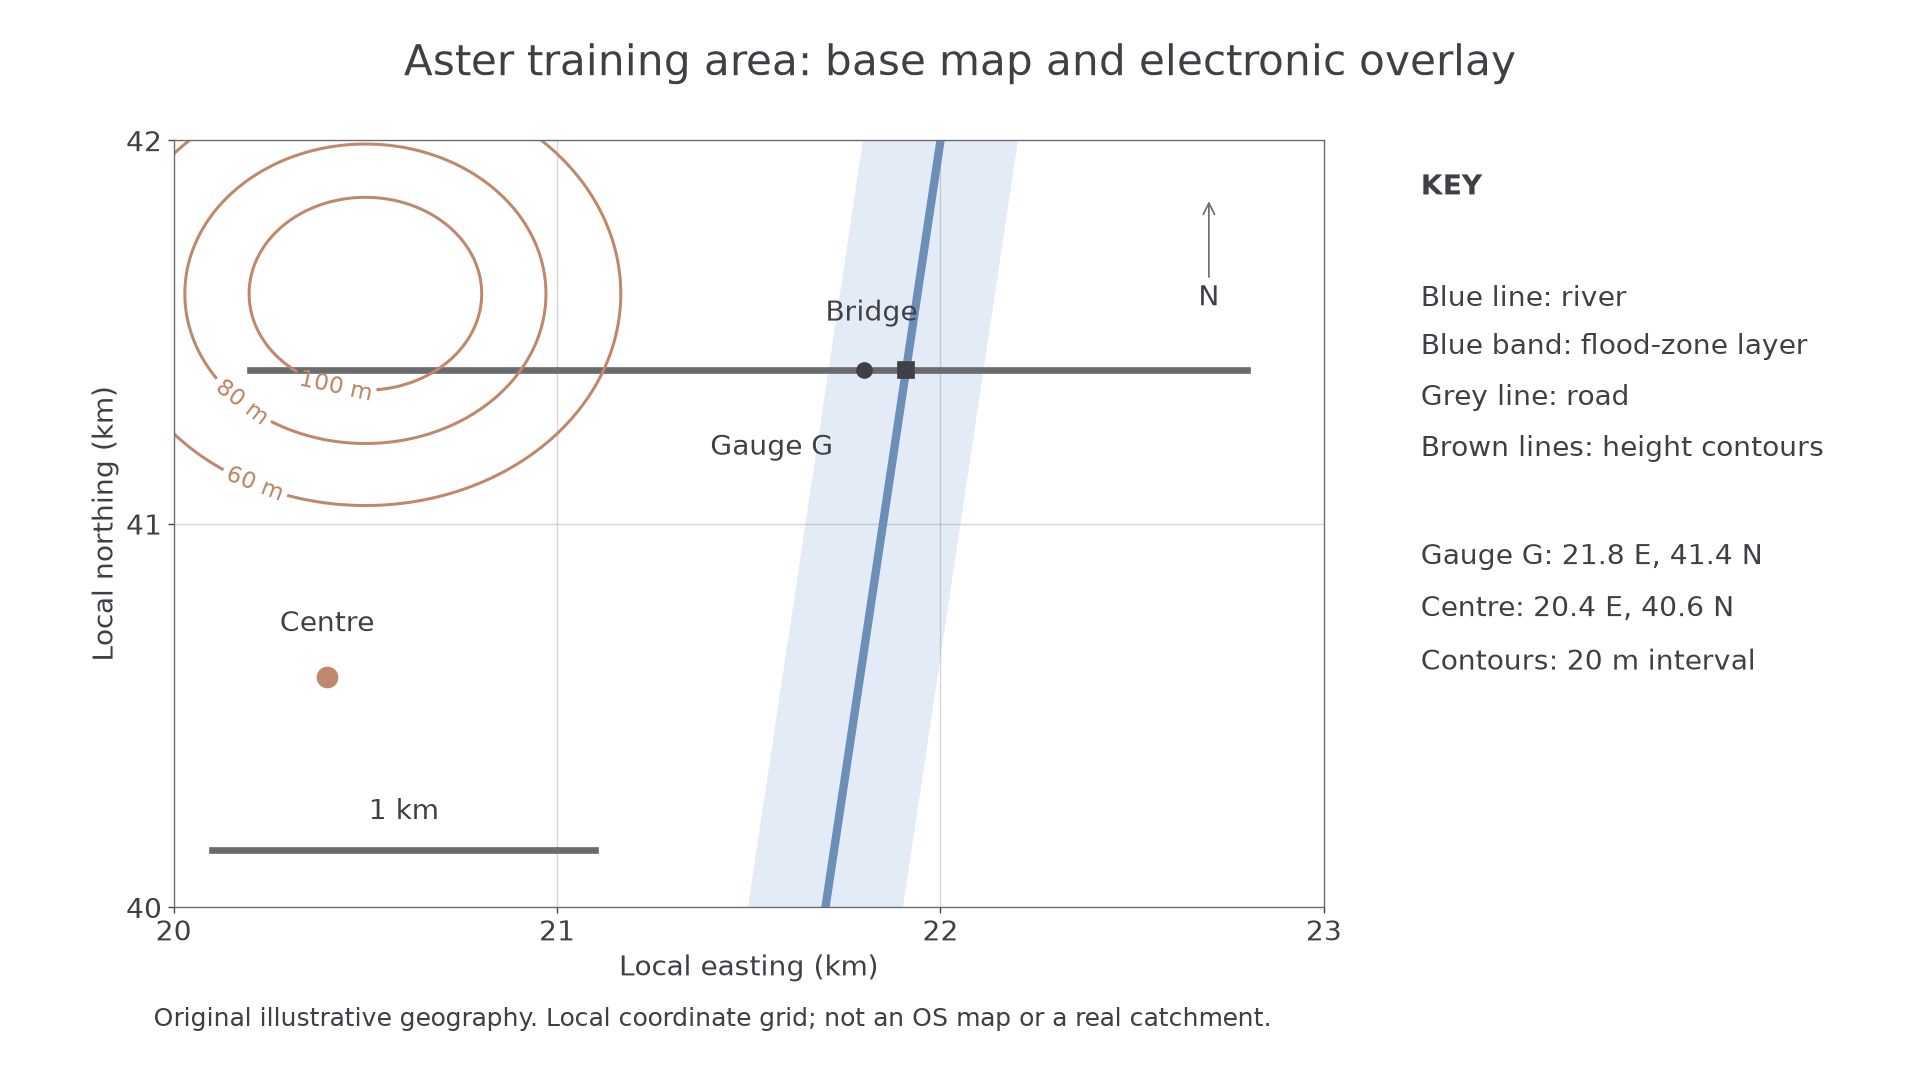
Original training geography, not a real catchment. Easting and northing axes are in kilometres; the north arrow and one-kilometre scale are supplied.
The centre is at local coordinates 20.4 east, 40.6 north. Gauge G is at 21.8 east, 41.4 north: it is north-east of the centre. Compass directions describe the direction from the stated starting point. North-west from G reverses neither axis: it means less easting and more northing.
A ratio scale of 1:25,000 means 1 cm on the map represents 25,000 cm, or 250 m, on the ground. A 3.2 cm straight-line distance represents 800 m. For a winding route, measure short straight segments and add them, or use a thread then measure its length. An electronic scale bar remains useful when an image is resized; a printed ratio is reliable only at the intended print size.
Area uses squared units. One 1 km by 1 km grid square is 1 km², or 1,000,000 m², not 1,000 m². Estimate irregular areas by counting complete squares and combining partial squares; state that the result is approximate.
Settlement site, situation and shape
A settlement's site is the land on which it stands: for example, a gently sloping terrace above a floodplain. Its situation is its position relative to other places and routes: for example, a river crossing linking two farming districts. These answer different questions. “Beside a bridge” describes a relationship; “on raised gravel” describes the ground occupied.
Shape can be compact or nucleated, linear along a route, or dispersed among fields. A linear arrangement along a valley may reflect flat buildable land and access, while a compact pattern around a junction may reflect a meeting point. Check both physical and human evidence. Buildings can spread along an old railway without the railway remaining the main reason people live there today.
To make a sketch map, select a boundary and a purpose, draw the main reference lines first, then add a few meaningful symbols. Include a title, key and north arrow; add a scale if distances are meant to be measured, otherwise state “not to scale”. An annotation adds explanatory meaning: “housing on higher terrace, above the mapped flood zone” is more useful than the label “houses”. Keep observations and inferred reasons distinguishable.
Photographs as landscape evidence
Photographs show texture, condition and relationships that a map may simplify. A ground photograph looks across a landscape: foreground objects can hide those behind them. An oblique aerial photograph looks down at an angle and covers a wider area, but apparent distances vary with perspective. A vertical aerial image looks almost straight down; an orthorectified image has been corrected to make its geometry more map-like. Satellite images cover large areas repeatedly, sometimes using wavelengths invisible to the eye. A false-colour image needs its own colour explanation.
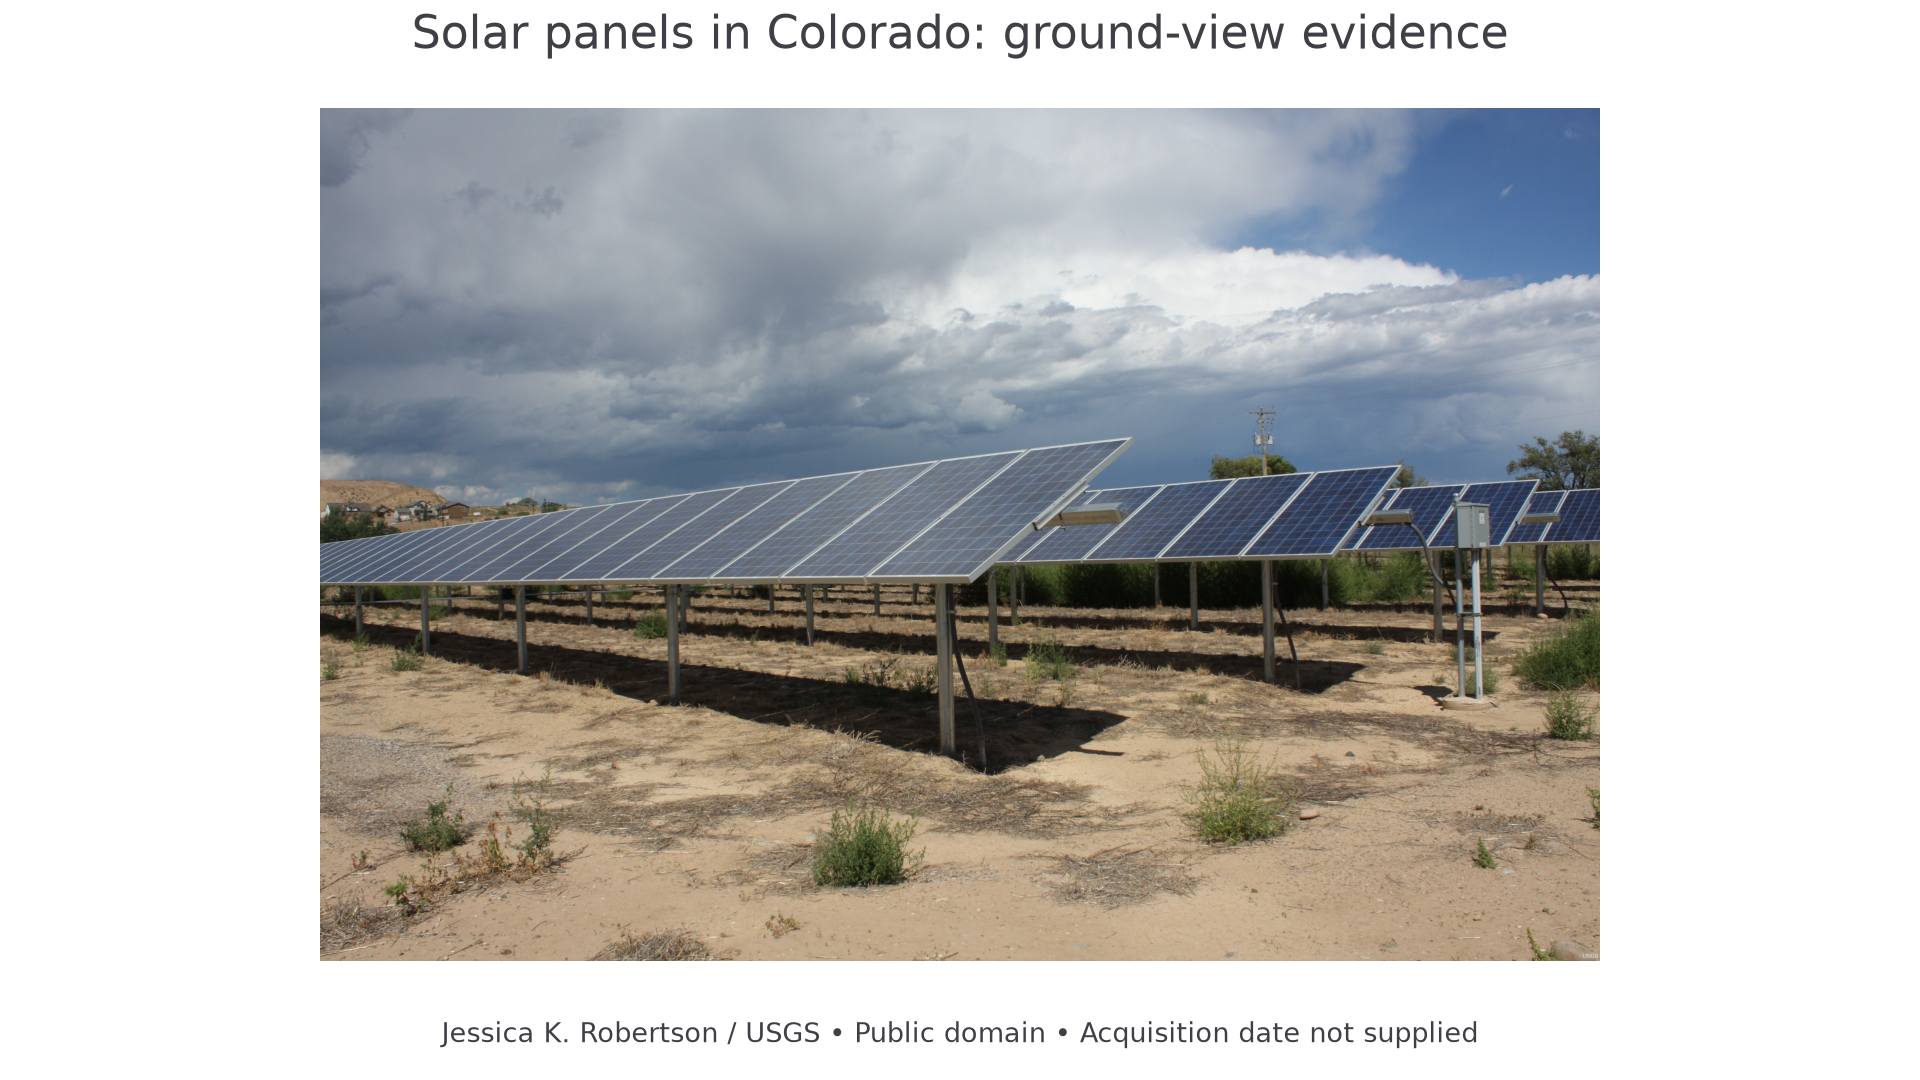
Solar panels in Colorado; Jessica K. Robertson, USGS, public domain. The image is a real ground photograph; its acquisition date is not supplied on the source page.
In this photograph, rows of panels and their supports are observations. “Electricity is generated here” is a well-supported inference from the equipment. “The nearby households receive all their electricity from these panels” is unsupported: the photograph does not show connections, output or demand. Annotate a photograph by linking each concise statement to a visible feature. Record place, date if known, viewing direction and what lies outside the frame. Do not invent a compass direction from a photograph without a reference.
Linking a photograph to a map helps locate the viewpoint and recognise the same road, river bend or building. A field sketch should simplify that evidence rather than copy every leaf: establish the horizon and major shapes, then annotate the features relevant to the enquiry. Retain a record of the original image so your selection can be checked.