1.4 - Hazard fieldwork: analysing extreme-weather evidence
Use 1.4 to connect weather-diary measurements, local feeds and mapped impacts. Learn how timing and exposure affect a conclusion, then evaluate how far evidence from one event can support a wider claim.
Presenting an event through time
A time series preserves the order and interval of observations. Plot temperature and pressure as suitable line graphs, rainfall totals as bars for their measured intervals, and wind speed according to whether the record is a mean or gust. Different units need labelled axes or separate panels; an apparent line crossing between hPa and m/s has no physical significance.
These original simulated school observations describe one passing event, not a historical storm or completed student investigation. Rainfall is the total in the three hours ending at the stated time.
| Time | Pressure (hPa) | Mean wind (m/s) | Wind from | Rain (mm) | Temperature (°C) |
|---|---|---|---|---|---|
| 09:00 | 1008 | 4 | S | 1 | 14 |
| 12:00 | 1002 | 8 | SW | 8 | 15 |
| 15:00 | 996 | 12 | SW | 12 | 13 |
| 18:00 | 999 | 14 | W | 4 | 10 |
| 21:00 | 1004 | 6 | NW | 1 | 8 |
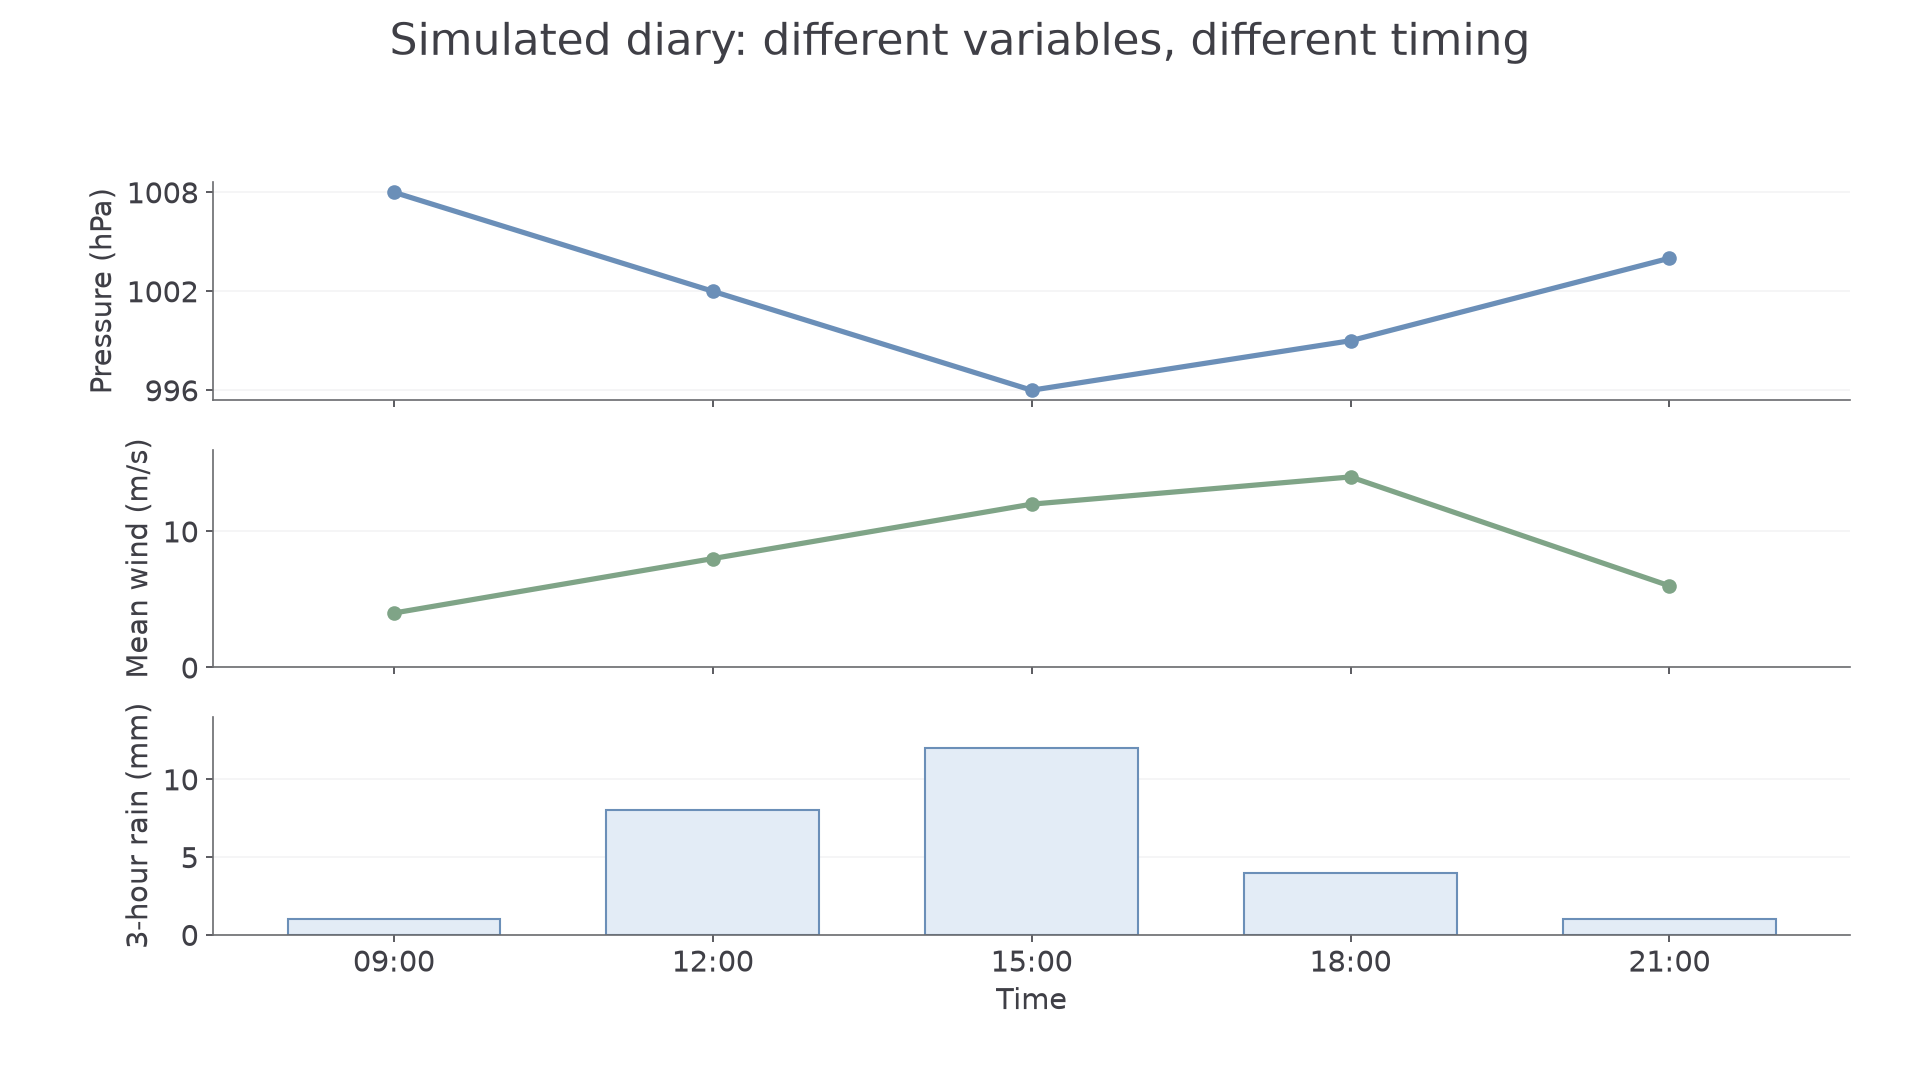
Separate panels preserve the different units. The lowest pressure is at 15:00; the strongest recorded mean wind is at 18:00.
The rainfall total is 26 mm. A wind rose can summarise the frequency of directions over many observations, but this five-reading diary is a small sample: two south-westerly readings give 40%, not proof that south-westerly wind dominated the whole day. Present the sample size alongside the percentage.
Combining the diary, feed and map
Suppose a separate simulated open-site station feed records its strongest mean wind at 17:00 and a dated local report describes fallen branches near an exposed road. A school GIS impact layer places that road outside the sheltered courtyard where the diary sensor stood. These sources help explain variation, but their values are not directly interchangeable.
Align time zones and averaging periods first. A 17:00 hourly maximum can fall between the school's three-hourly readings; different sampling intervals may explain an apparent disagreement. The open station and courtyard have different exposure. A branch-fall report is qualitative impact evidence, not a direct measurement of wind speed. Site photographs/sketches help identify shelter or vulnerable features, while the feed supplies a more complete atmospheric time sequence.
Review source provenance: was the report written during or after the event, are observations confirmed, and does the station record have missing values? A live feed can update or remove provisional values, so preserve the exact dated snapshot used. Corroboration is strongest when sources add relevant, sufficiently independent evidence.
Continue this lesson.
You’re previewing NovaLearn without an account. Create a free account to read the rest.
Create free account