1.1 - River regimes and storm hydrographs
A river can vary through the year and respond rapidly to an individual storm. Learn to distinguish those timescales, read rainfall and discharge evidence, and explain how catchment conditions and human decisions change the response.
Annual river regimes
Discharge is the volume of water passing a point each second, normally measured in cubic metres per second. A river regime describes the pattern of discharge through a year. Comparing mean monthly discharges over several years reduces the influence of one unusual storm, but can conceal extreme events within each month.
Precipitation supplies water to a basin, yet rainfall and discharge peaks need not coincide. In a monsoon climate, a pronounced wet season often produces high seasonal discharge. In a cold mountain basin, winter precipitation can be stored as snow; discharge rises when warmer spring or summer conditions melt it. Temperature also affects evapotranspiration: a warm month can lose more water to the atmosphere, leaving less to reach the river.
Consider two illustrative regimes. River A peaks in the rainy summer; River B peaks after winter snow melts. The same calendar month therefore has different meanings in each basin. Use the rainfall and temperature evidence to explain the timing. Do not assume a named climate guarantees an identical regime: lakes, geology, abstraction and dams can modify the pattern.
The Met Office's Durham station series provides this observed weather sequence from northern England:
| Month in 2023 | January | February | March | April |
|---|---|---|---|---|
| Rainfall total (mm) | 36.6 | 19.6 | 53.0 | 50.0 |
| Mean daily maximum temperature (°C) | 7.8 | 10.0 | 9.9 | 12.0 |
| 1991–2020 mean monthly rainfall (mm) | 53.1 | 45.5 | 41.1 | 51.2 |
| 1991–2020 mean daily maximum temperature (°C) | 6.9 | 7.8 | 9.9 | 12.5 |
March 2023 received 33.4 mm more rain than February, although its mean daily maximum temperature was 0.1°C lower. January 2023 rainfall was 16.5 mm below the January climate average. Read each variable and baseline separately before proposing a link with flow.
The baseline rows are arithmetic means calculated from thirty observations for each calendar month in the same station series, rounded to one decimal place and including the Met Office's flagged estimated values. Four months of 2023 describe a weather sequence; the thirty-year baseline describes typical seasonal climate. One unusual month cannot establish a climate trend. Durham lies outside the Tees basin, so neither row supplies the Tees's basin rainfall or discharge directly.
Reading a storm hydrograph
A storm hydrograph shows river discharge before, during and after one rainfall event. Rainfall is commonly shown as bars using a separate axis; the discharge curve uses its own units. The rising limb records increasing discharge, the peak discharge its maximum, and the falling limb the subsequent decline. Water arriving slowly from soil and groundwater helps sustain baseflow before and after the storm.
Lag time is the time between peak rainfall and peak discharge. State the convention and time interval used: hourly bars identify an interval's rainfall, rather than an instantaneous measurement. The illustrative data below treat each rainfall value as plotted at its labelled hour.
| Hour | 0 | 1 | 2 | 3 | 4 | 5 | 6 | 7 | 8 |
|---|---|---|---|---|---|---|---|---|---|
| Rainfall (mm) | 0 | 4 | 12 | 8 | 2 | 0 | 0 | 0 | 0 |
| Discharge (m³/s) | 5 | 5 | 7 | 13 | 22 | 18 | 12 | 8 | 6 |
Peak rainfall is at hour 2 and peak discharge at hour 4, so lag time is hours. Peak discharge is 22 m³/s, not the 12 mm rainfall maximum. The falling limb continues after rain stops because stored water still drains through the basin.
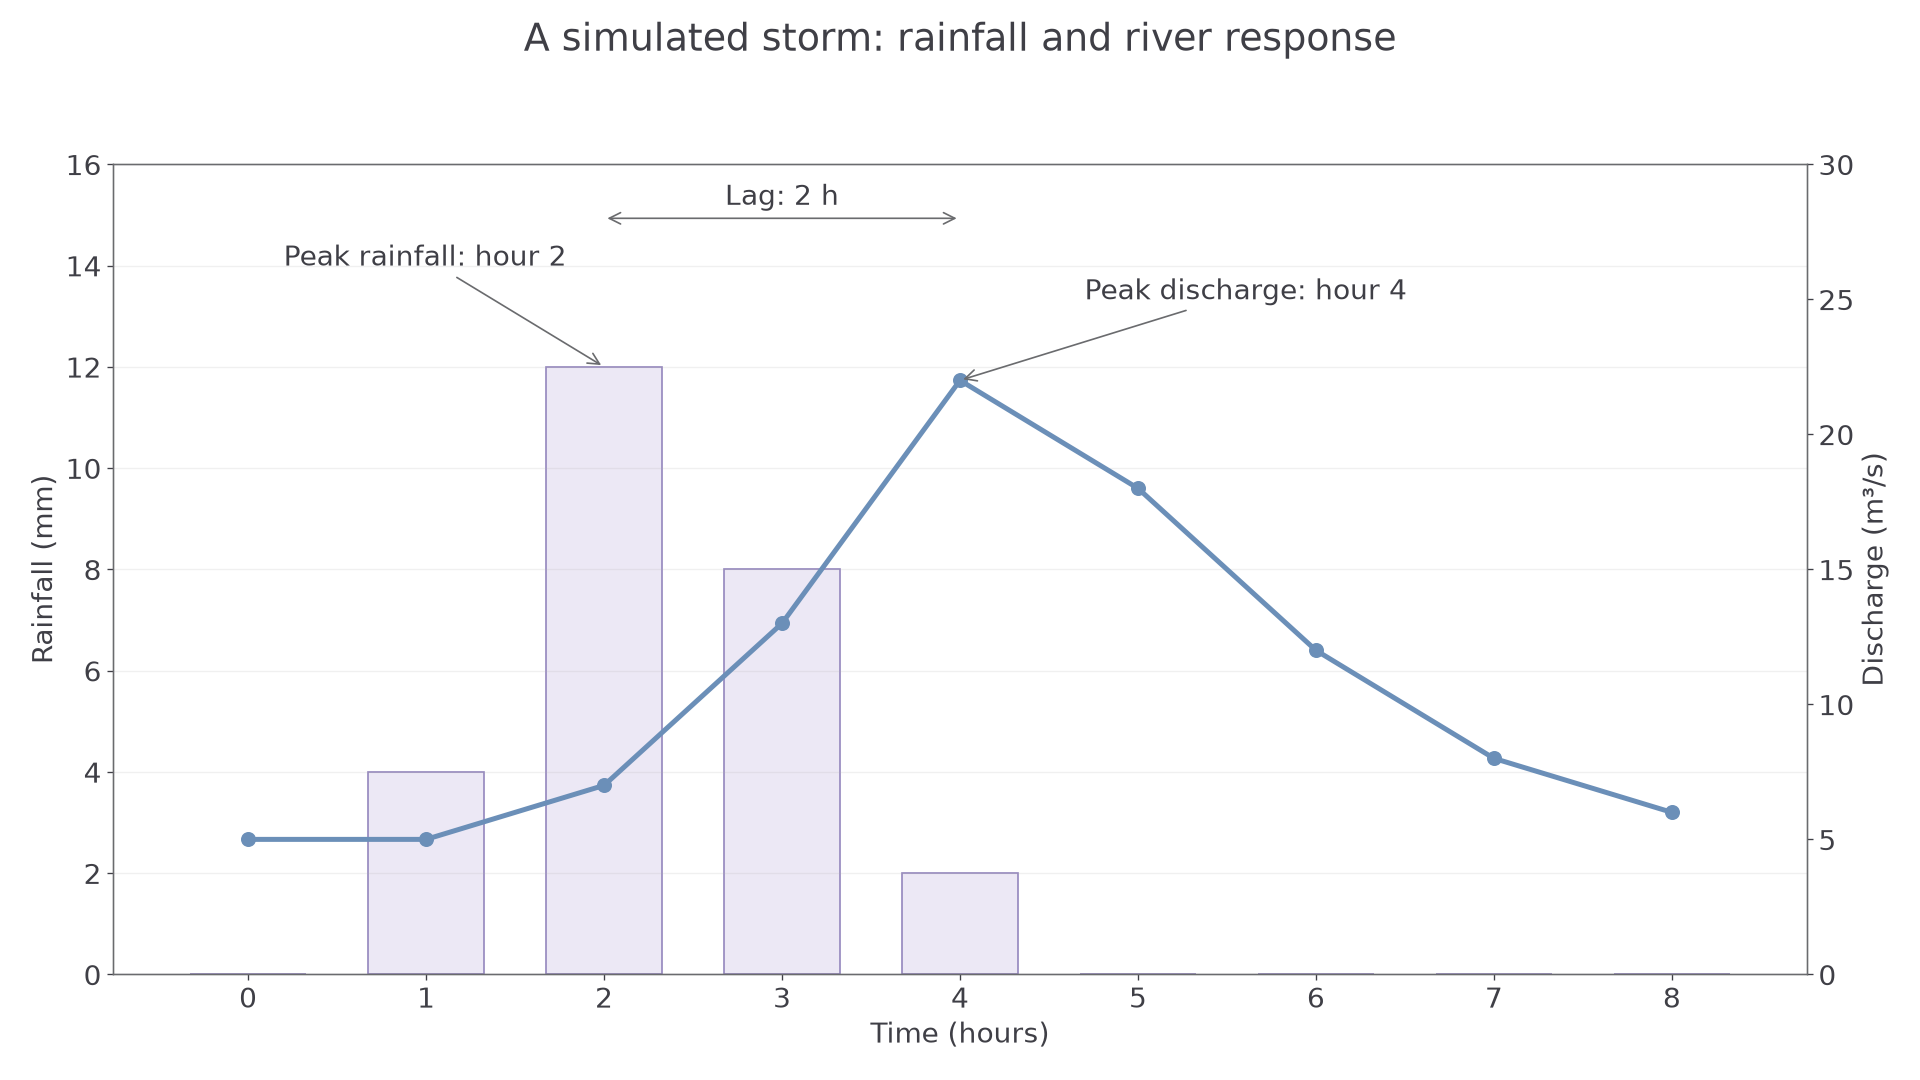
Simulated teaching data, not observations from a named river. The separate axes measure different quantities.
To construct the graph, put time on a shared horizontal axis, choose labelled rainfall and discharge axes, plot every value accurately, and connect discharge observations in time order. Use straight segments between observations rather than inventing a precisely known smooth peak. A correct plot contains the observations as well as the overall shape.
Why catchments respond differently
Intense rain can exceed infiltration capacity, producing rapid surface runoff. Prolonged rain can fill soil stores until even moderate additional rain creates runoff. Both can steepen a hydrograph's rising limb, but through different mechanisms. Saturated ground does not become the same thing as impermeable rock: it simply has little remaining capacity to store water.
Vegetation intercepts rain, roots can improve soil structure and infiltration, and transpiration can reduce soil-water storage between storms. Removing vegetation may therefore increase and accelerate runoff. The effect depends on soil, season, rainfall and how land is managed. Compacted agricultural soil can reduce infiltration even where a field looks green.
Urban roofs and roads reduce infiltration. Drains and straightened channels can deliver water quickly to the river, shortening lag time and increasing peak discharge. Steep slopes also favour rapid movement downslope. Permeable geology may allow more infiltration and groundwater storage, delaying arrival. A catchment's response reflects interacting conditions, not a single universal ranking.
Abstraction, dams and evidence
Abstraction removes water from rivers, reservoirs or aquifers for use. River abstraction can reduce downstream discharge directly. Groundwater abstraction can reduce later groundwater contributions, so its effect may be delayed. Demand can be highest in hot, dry weather when supplies are already low, making the seasonal shortage worse.
A dam creates storage and allows controlled releases. Keeping space available in a reservoir can hold back floodwater and lower or delay a downstream peak. Releasing stored water in a dry season can maintain supply or flow. However, a reservoir that is already full has less spare flood storage, and releases change the natural regime. Dams do not stop every flood and cannot remove water from the global cycle.
To assess a change, compare rainfall, discharge and land-use or reservoir evidence over compatible periods. A lower peak after a dam was built might reflect the dam, a weaker storm, drier starting soils or a combination. Use catchment maps to check whether rainfall fell over the same contributing area. Weather data describe short-term events; climate data describe longer-term patterns. Both are useful, but they answer different questions.
A hydrograph describes what happened; an explanation connects the pattern to rainfall, existing storage, flow routes and management, while testing alternative causes.