6.1 - Urbanisation, megacities and rapid growth
Cities grow through several processes, and a growing urban population is not always the same as a growing urban share. Learn to compare fifty years of urbanisation, explain the emergence of megacities and investigate the pressures of rapid growth using maps and photographs.
Urbanisation and urban growth
Urbanisation is an increase in the proportion of a population living in urban areas. Urban population growth is an increase in the number of urban residents. The two can occur together, but are not identical.
Suppose a country has 10 million people, of whom 4 million live in urban areas: its urban share is 40%. Later, it has 20 million people, including 8 million urban residents. The urban population doubled, but its share remains 40%. If the urban number instead reaches 10 million, the share becomes 50% and urbanisation has occurred.
Urban places also expand physically as buildings replace other land uses or settlements merge. An administrative boundary can change without everyone moving. Countries define urban areas differently using criteria such as settlement size, density, services or administrative status; comparisons need that qualification.
Megacity
A city with at least 10 million inhabitants. Check the population boundary used, such as an urban agglomeration, before comparing figures.
Greater London, the small historic City of London and London's wider commuting region are different areas. Likewise, municipal Mumbai, its urban agglomeration and its metropolitan region have different totals. A population figure without its boundary can mislead.
Contrasting fifty-year trends
World maps reveal that countries can have different urban levels and different changes. The maps below select examples from Europe, South Asia and West Africa; grey land is not a claim of zero urban population.
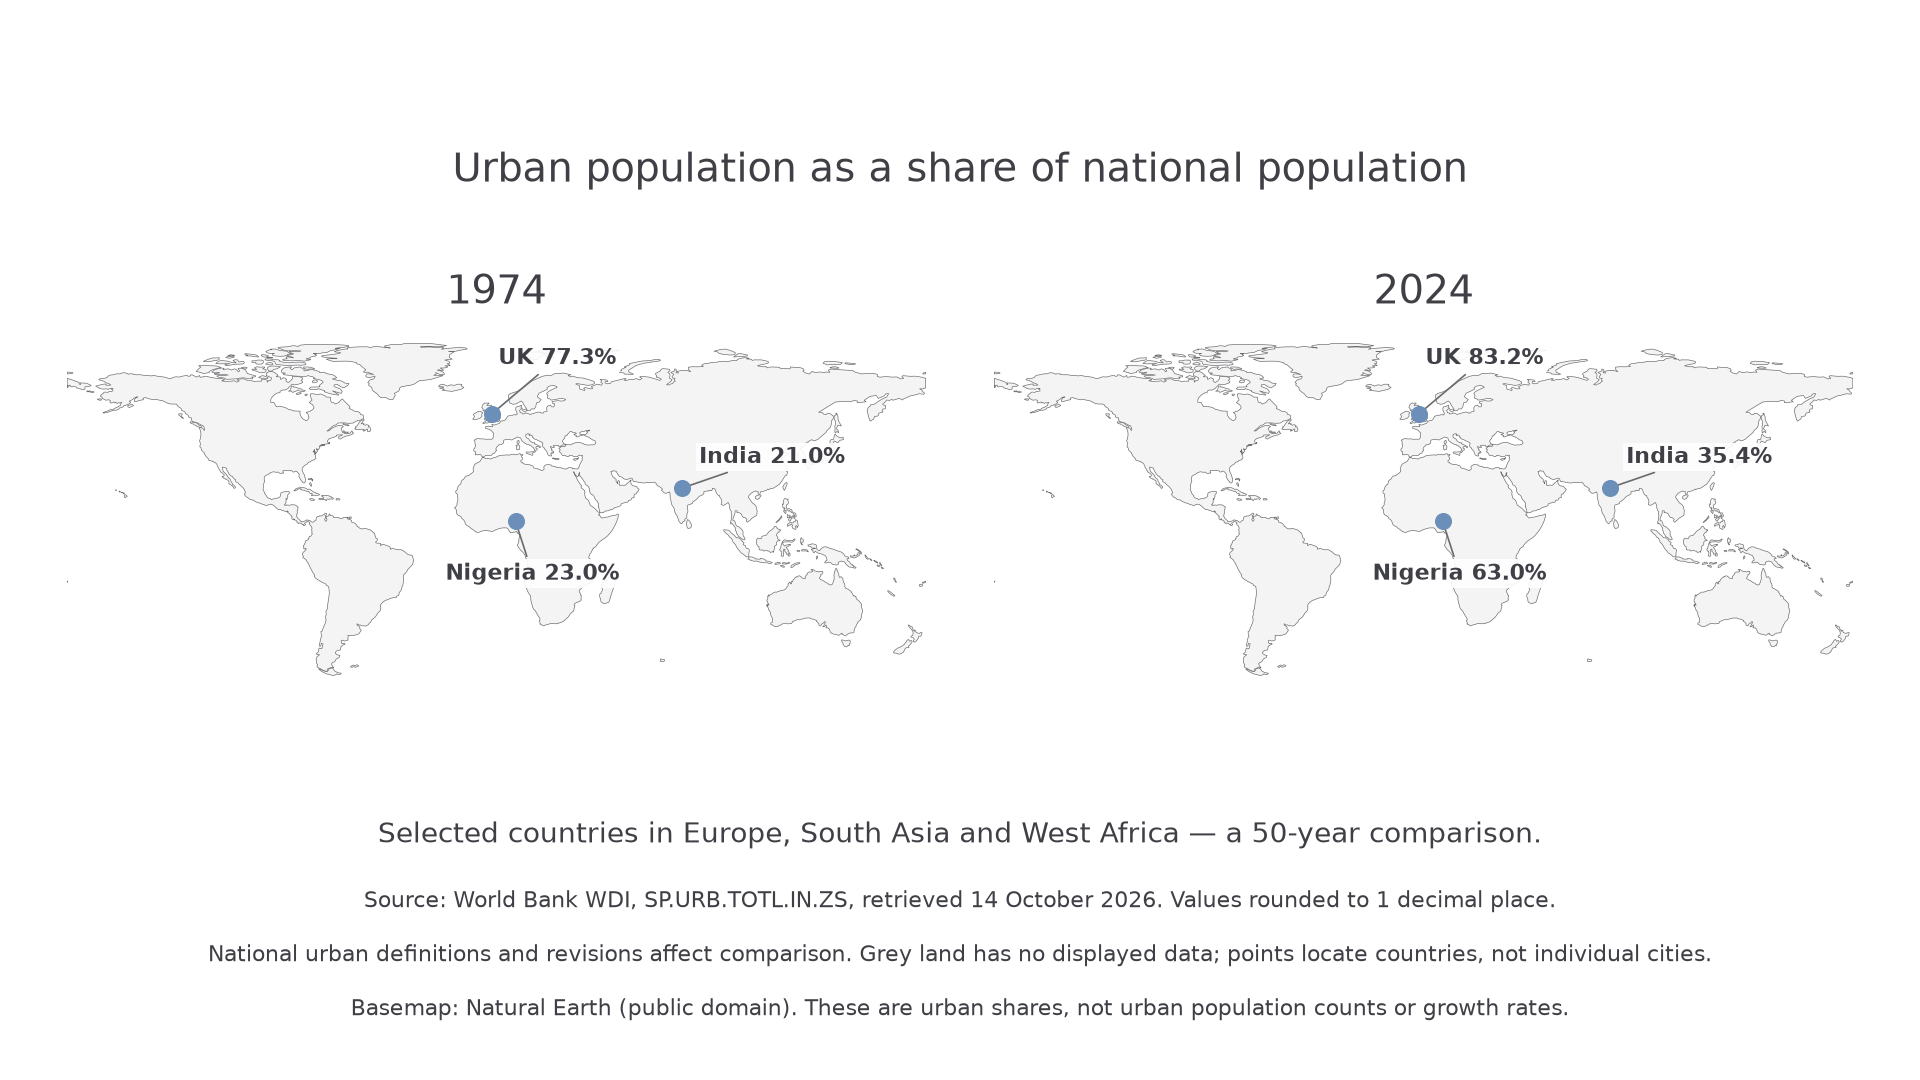
World Bank WDI indicator SP.URB.TOTL.IN.ZS, retrieved 14 October 2026, rounded to one decimal place. National definitions and later revisions affect comparison. The maps locate countries, not individual cities; Natural Earth basemap, public domain.
The UK was already highly urbanised in 1974 and its displayed urban share rises from 77.3% to 83.2%. Nigeria's displayed share rises from 23.0% to 63.0%, a much larger increase of 40 percentage points. India's share rises from 21.0% to 35.4%, about 14 percentage points. These figures illustrate contrasts; one country cannot represent every place in its region.
Do not confuse the highest final share with the greatest change. The UK has the largest displayed 2024 share, while Nigeria has the largest increase. Nor can the maps tell us the number of new urban residents without total populations. A smaller percentage-point change in a very populous country can still involve many people.
Maps also hide variation among cities and rural areas. Explain broad patterns using economic development, population change, migration and policy, then test with more detailed evidence. A fifty-year comparison does not show that the rate was constant in every intervening year.
Why cities and megacities grow
Rural-urban migration increases a city's population when arrivals exceed departures. Rural push factors can include insecure farm income, land shortage, hazards or limited services; urban pull factors include jobs, education, healthcare and social networks. Expectations do not guarantee that suitable work or housing will be available.
Natural increase occurs when births exceed deaths. A city can grow rapidly from natural increase even without a large net migration flow. Migration by young adults can also affect later births, linking the processes. Reclassification and the merging of settlements add further growth without all residents physically moving.
Megacities emerge where long-term population growth combines with concentrated economic and political opportunities. Ports, transport hubs, government functions and clusters of firms attract investment and workers. Existing markets draw more businesses, reinforcing growth. But not every growing city reaches 10 million: regional networks, policy and geographical constraints shape the pattern.
Continue this lesson.
You’re previewing NovaLearn without an account. Create a free account to read the rest.
Create free account