2.4 - Urban fieldwork: evaluating regeneration evidence
Use 2.4 to connect urban survey records, photographs and local reports. Learn to judge regeneration evidence while distinguishing visible physical change from its effects on different people.
Comparing urban sites and responses
Processing should retain each site's location, time, observer and scale. Tally closed responses, show valid totals and calculate percentages. Compare EQS components with identical axes/scales in radial or grouped/compound graphs, then map sites in GIS against the scheme boundary and relevant secondary evidence. A high total should not conceal one poor component.
These original simulated records concern fictional Cedar Ward. Respondents were asked whether crossing the street during their visit was easy. The EQS scale is 0–5, higher meaning better quality, observed under comparable stated conditions.
| Site | Easy responses / respondents | Litter score | Building-condition score | Pedestrian-access score |
|---|---|---|---|---|
| Renewed Square | 16 / 20 | 4 | 5 | 4 |
| Adjacent Street | 9 / 30 | 2 | 3 | 2 |
The easy shares are 80% and 30%, a 50 percentage-point difference. The combined share is 25/50 = 50%; averaging the two site percentages gives 55% and overweights the smaller sample. Retain the site contrast because the overall percentage hides a difference relevant to the enquiry.
If the square's pedestrian-access scores from three observers are 3, 4 and 5, their mean is (3+4+5)/3 = 4, matching the table's reported summary. The range is 2 and reveals disagreement that the mean hides. Interpret this ordinal score cautiously: the arithmetic is a reporting convention, not proof that a score of 4 represents twice the accessibility of 2. Review the descriptors and the observers' notes before drawing a conclusion.
What images and reports do—and do not—show
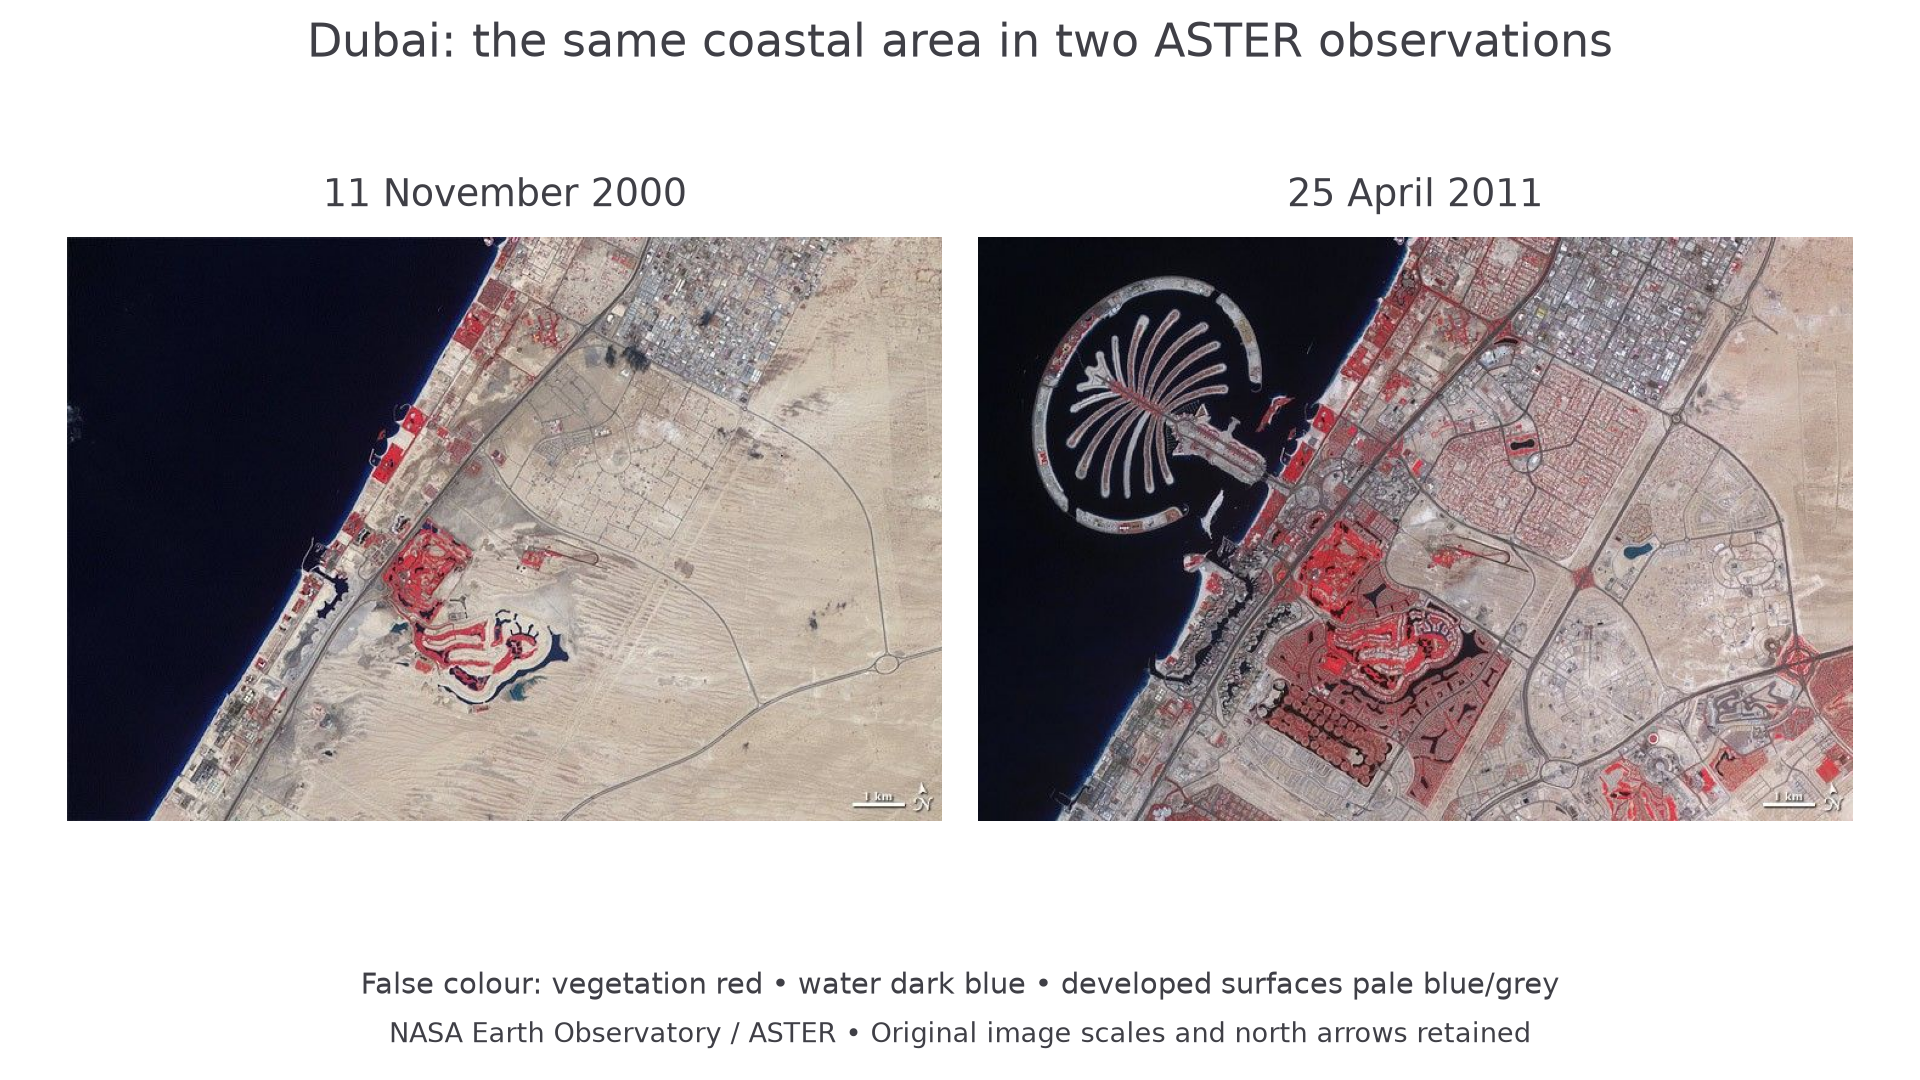
NASA Earth Observatory: 11 November 2000 and 25 April 2011. This real broad-scale urban-change example is separate from the fictional Cedar Ward survey; vegetation appears red in these false-colour images.
The images support visible built-land change at the same broad extent. They cannot show street-level crossing experiences, rent changes or whether residents benefited. A new development visible from above can justify a research question, but a small-scale EQS needs finer local evidence. Do not use broad urban growth as if it were a measured result from an inner-area fieldwork site.
For the simulated Cedar Ward enquiry, a constructed local report states that a square's paving and crossings were renewed in 2024. A distinct historic land-use map records former warehouses at part of the site; an annotated current ground photograph records a step-free crossing. An interview describes easier access, while another resident reports higher rents. These sources add timing, physical evidence and experience, but their extent/selection must match the conclusion.
Continue this lesson.
You’re previewing NovaLearn without an account. Create a free account to read the rest.
Create free account