Appendix 4, Appendix 6 - Reading specialist geographical graphs
Use Appendix 4's specialist graphs and maps to compare composition, direction and spatial patterns. Appendix 6 adds complex fieldwork displays: learn to decode their scales before making a geographical claim.
Three proportions on a triangular graph
A triangular graph plots three components of one whole. Each vertex represents 100% of its named component and 0% of the other two. A point on the opposite side represents 0% of that component. Lines parallel to that opposite side hold its percentage constant. Read each axis in its indicated direction: triangular axes do not all increase left to right.
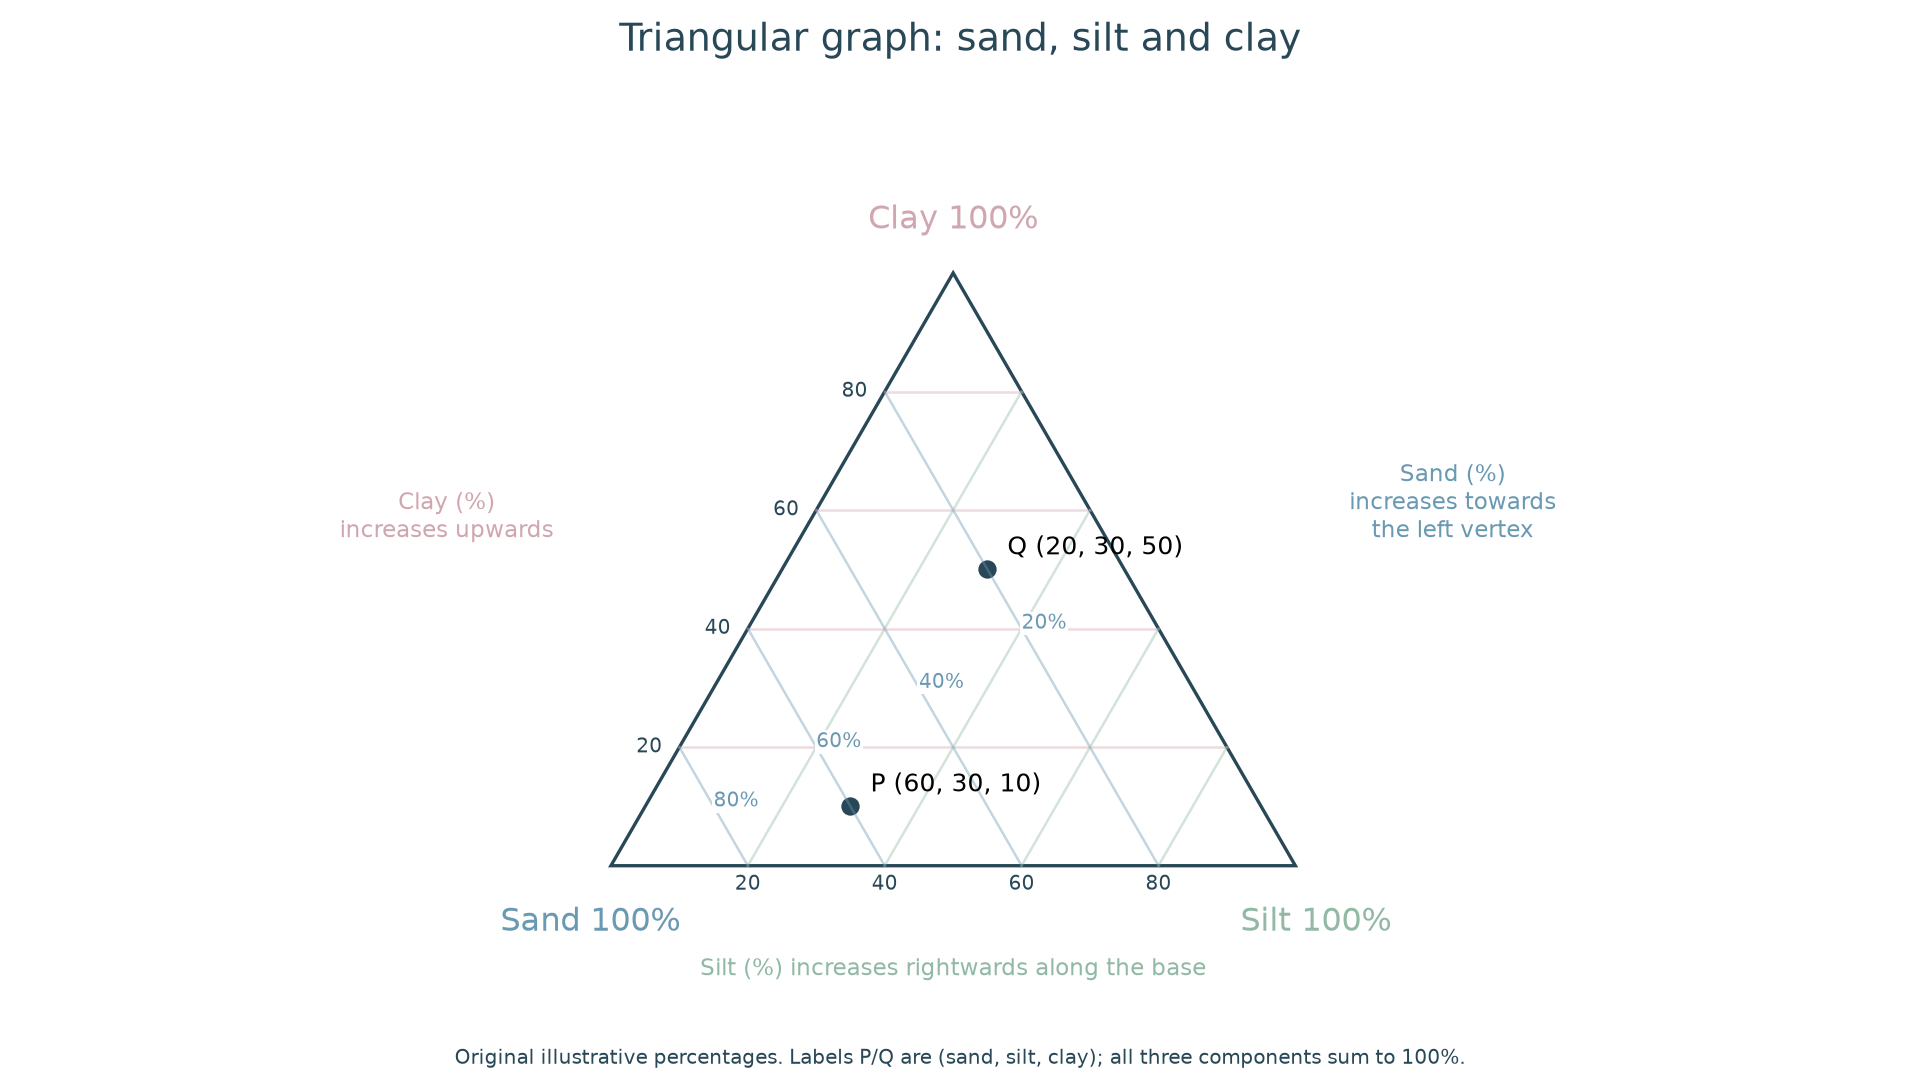
Original illustrative compositions. P is 60% sand, 30% silt and 10% clay; Q is 20%, 30% and 50% respectively. Every composition totals 100%.
To plot P, find the 60% sand line parallel to the silt–clay side and the 30% silt line parallel to the sand–clay side. Their intersection fixes P; the clay reading should be 10%, providing a check. To read Q, its horizontal position alone is insufficient: follow the relevant parallel lines back to each scale. Sketch a triangle and plot a new composition to practise construction; a submitted plotted image allows the positions to be assessed.
The same method can show employment structure if the three categories are primary, secondary and tertiary plus quaternary combined. If the sectors are recorded separately, combine tertiary and quaternary before plotting three shares. A country with 10%, 20% and 70% plots near the services vertex. This describes employment shares, not each sector's output or the country's total workforce.
Radial graphs and wind roses
A radial graph has axes radiating from a centre. Plot each variable along its own axis and join the points if a profile comparison is useful. An environmental survey might score noise, litter, greenery and building condition from 0 to 5. A point farther out means a higher score under that axis's definition. Use the same orientation and scales when comparing sites. Joining scores into a polygon does not make polygon area a reliable total: changing the axis order can change its shape and area.
A wind rose also uses directions around a centre, but its spokes show the direction the wind came from. A long south-west spoke means frequent south-westerly winds, travelling towards the north-east. Concentric rings may represent counts or percentages; stacked colours may divide wind-speed bands. Check whether calm observations are separately shown and whether the percentage total includes them.
To construct one, tally wind observations into stated direction categories, calculate each category's share and choose a common radial frequency scale. Place north at the top and directions clockwise, then draw each directional bar to its frequency. For 100 non-calm observations, 25 from SW requires a SW bar reaching 25%; record calm separately if excluded from that denominator. If dividing by speed, stack the speed-band frequencies within each direction and supply a key. Do not rotate the direction to where the wind is going.
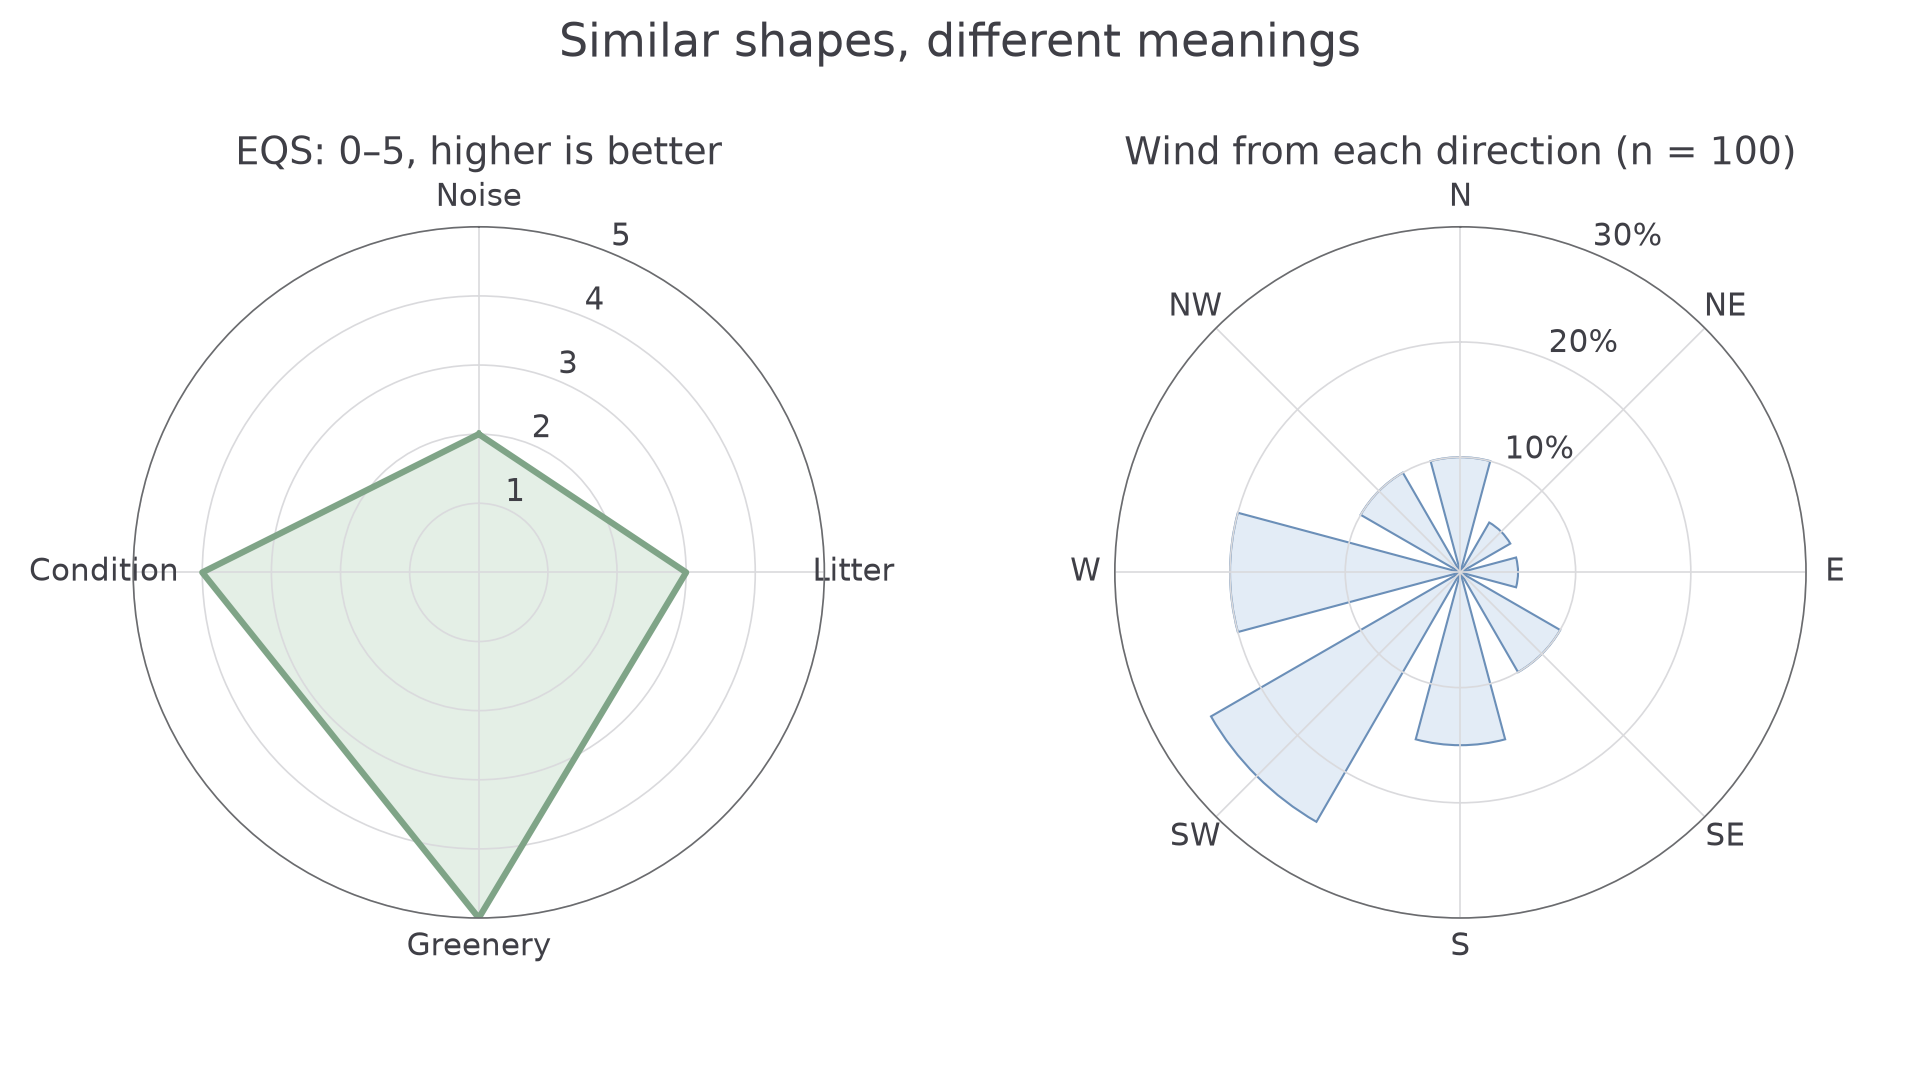
The EQS axes all score 0–5, with higher meaning better quality. The wind rose records 100 non-calm observations; 25 came from the south-west, the most frequent direction.
The two displays look similar but answer different questions. The radial graph compares several criteria at one site; the wind rose describes the frequency of one directional variable. If wind observations were made only each morning, the rose describes those sampled times, not necessarily the full daily wind regime.
Choropleths and proportional symbols
A choropleth map shades whole areas according to a value range. Read the key's boundaries carefully: “20–<40%” excludes 40%. Rates, densities and percentages usually support comparisons better than raw totals because areas and populations differ. Shading a large district by total population can make a sparsely populated large area appear equivalent to a crowded small one. Every resident within a shaded district does not share its average characteristic, and the map conceals variation inside its boundaries.
A proportional-symbol map scales symbols to a quantity at a location or area. Check whether area, length or another dimension represents the value. For circles whose area is proportional to population, four times the population needs twice the radius, not four times. Use the key rather than judging unfamiliar sizes by eye.
To construct a choropleth, calculate a comparable rate/density, choose clear non-overlapping classes that include every value, shade areas consistently and provide a class key with units/date. Different class boundaries can alter the apparent pattern, so retain the original values. For area-proportional circles, choose a reference: if 200 people use radius 2 mm, 800 people use radius 4 mm and 1600 use about 5.66 mm. Place each at its stated location, include a size key and avoid obscuring nearby values.
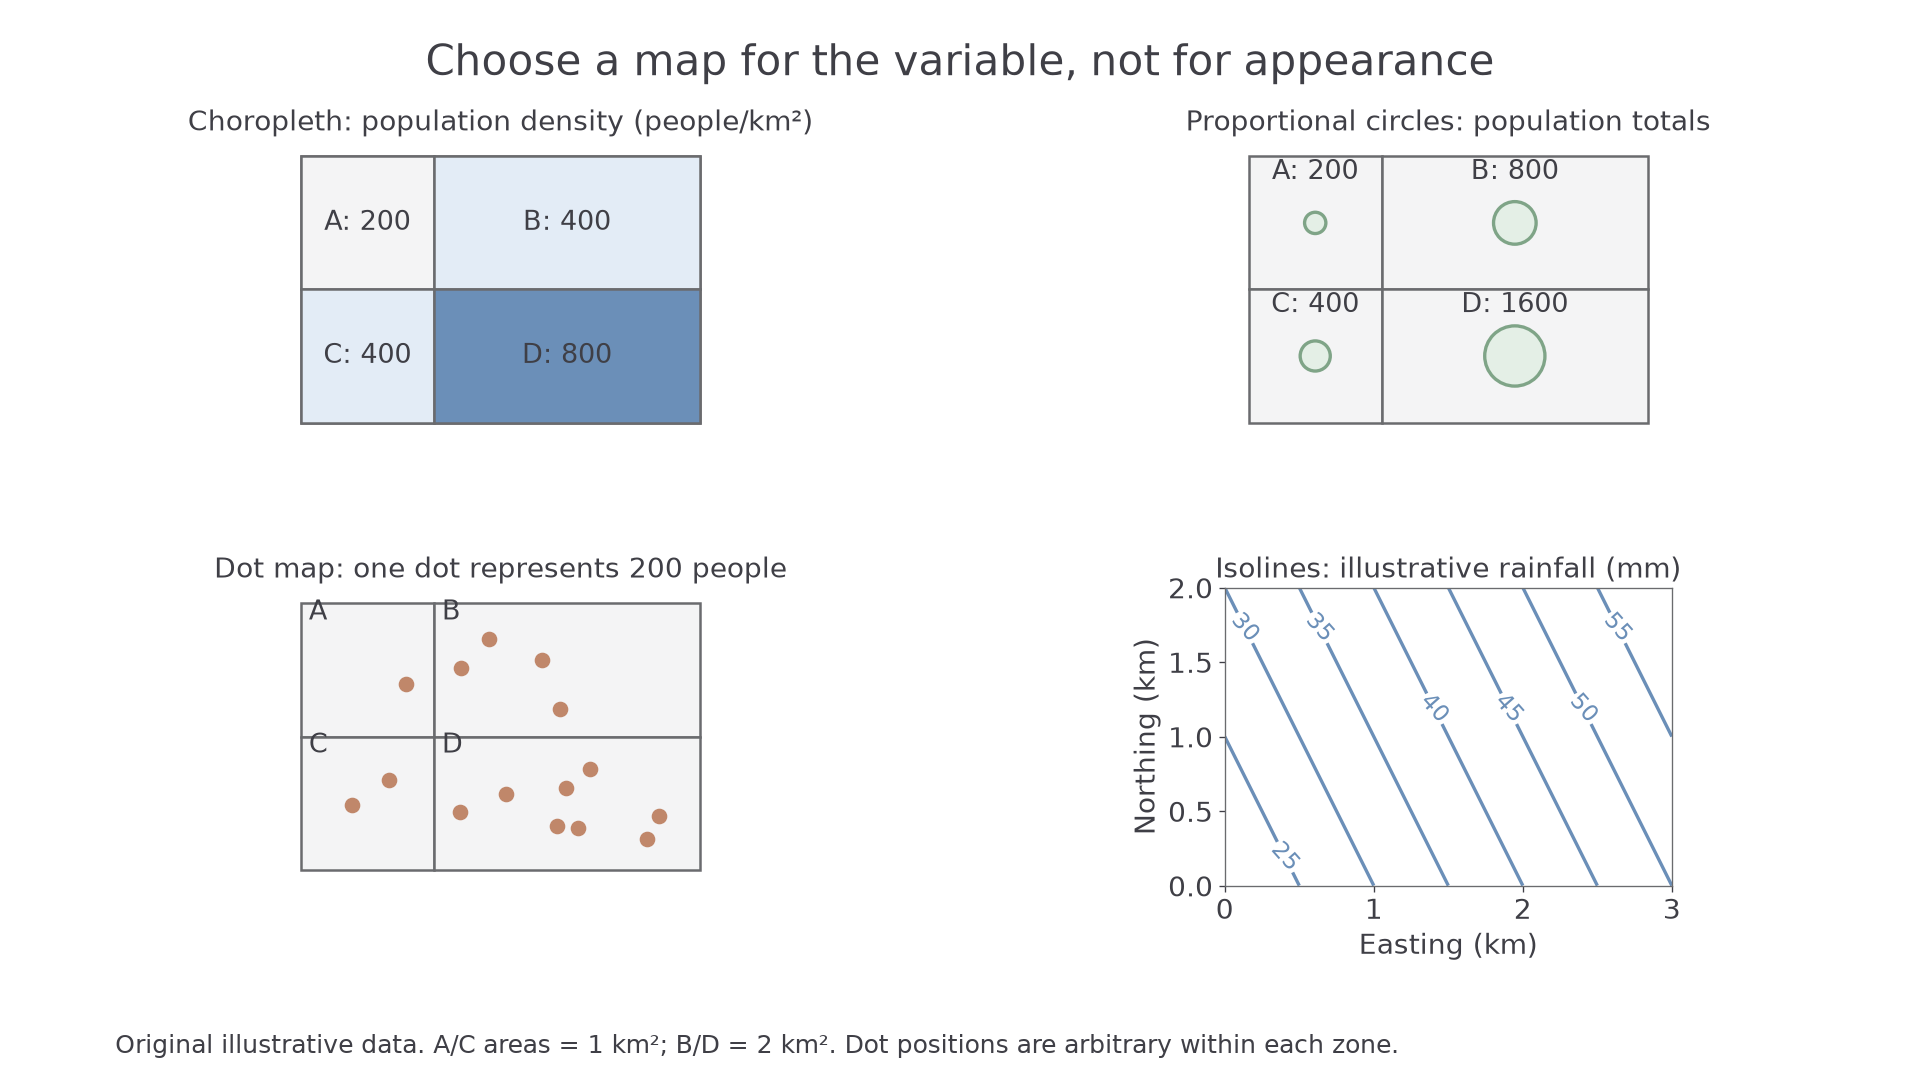
Original illustrative data: A/C are 1 km²; B/D are 2 km². The top panels show why density and total population answer different questions.
Area B has 800 people spread across 2 km², so its density is 400 people/km². Area C has only 400 people but also half the area, so it has the same density. The circle map reveals their different totals. The choice of representation changes what is immediately visible without changing the data.
Flow maps and population pyramids
A flow line map shows movement between origins and destinations. Arrow direction identifies the movement; line width may represent its magnitude. Check the key: a line twice as wide may represent twice as many people, but perspective and overlapping routes can obscure it. A straight connection between cities need not be the actual road or flight path. Distinguish incoming, outgoing and net flows; a small net balance can conceal large movements in both directions.
To construct one, locate the origins/destinations, choose a width scale and draw arrows with the correct direction. With 1 mm representing 20 journeys, A-to-B 80 uses a 4 mm line and A-to-C 20 uses a 1 mm line. Include the time interval and magnitude key; use a mapped route only when the data actually record that route. Separate opposing flows rather than replacing both with an unexplained net value.
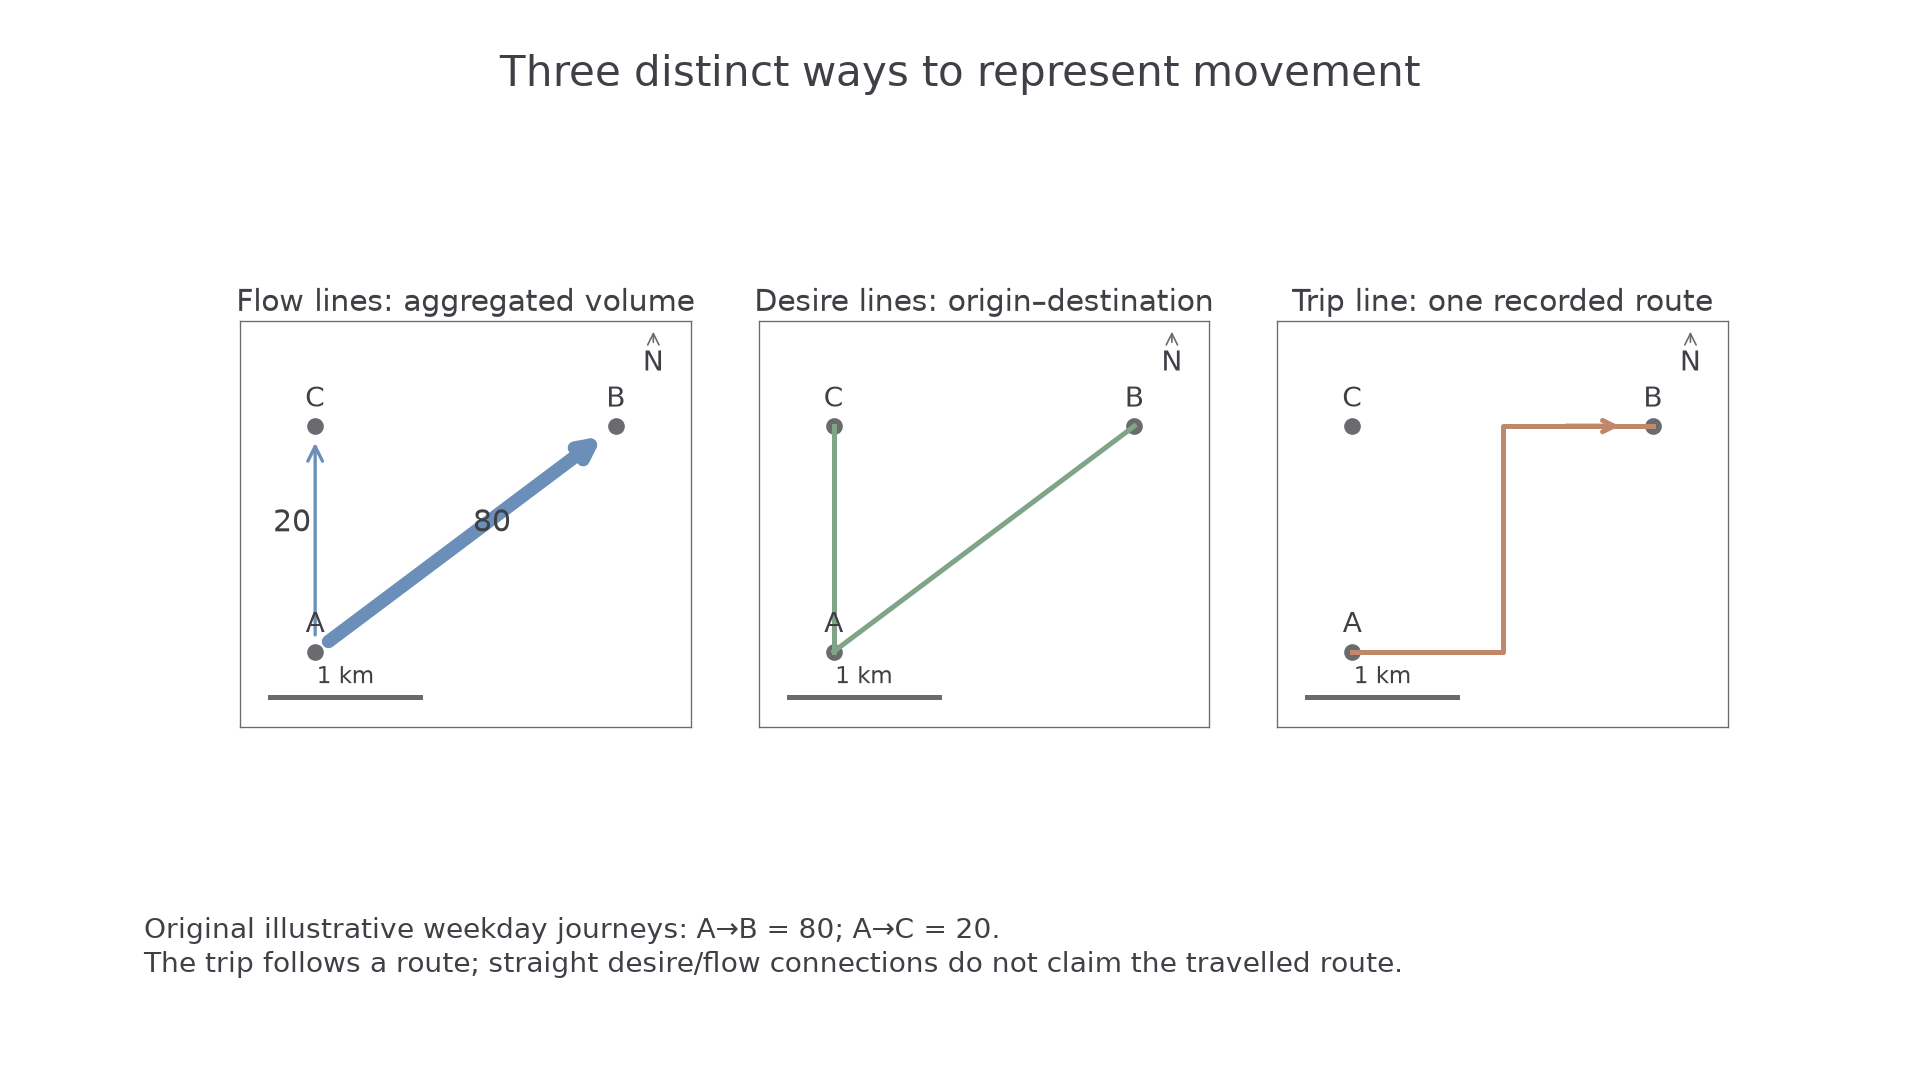
Original training journeys: 80 A-to-B and 20 A-to-C. Only the trip line claims a recorded route.
A population pyramid places age groups vertically, usually with males on one side and females on the other. Bar length shows the labelled count or share. First read the date, units and age intervals. A broad base relative to older cohorts may indicate recent large birth cohorts, but migration and changing survival also influence shape. A narrow 20–24 cohort cannot be explained as low births without checking migration and the population's history.
To read a total for an age group, add both sides. If ages 0–4 are 4% male and 4% female on axes showing share of the whole population, that group is 8%, not 4%. If the axes show percentages within each sex, use those different denominators instead. An open-ended 85+ cohort covers more years than a five-year cohort; direct comparison needs care. Use the pyramid as evidence for a reasoned interpretation, then check it against demographic data rather than diagnosing a country from its silhouette alone.
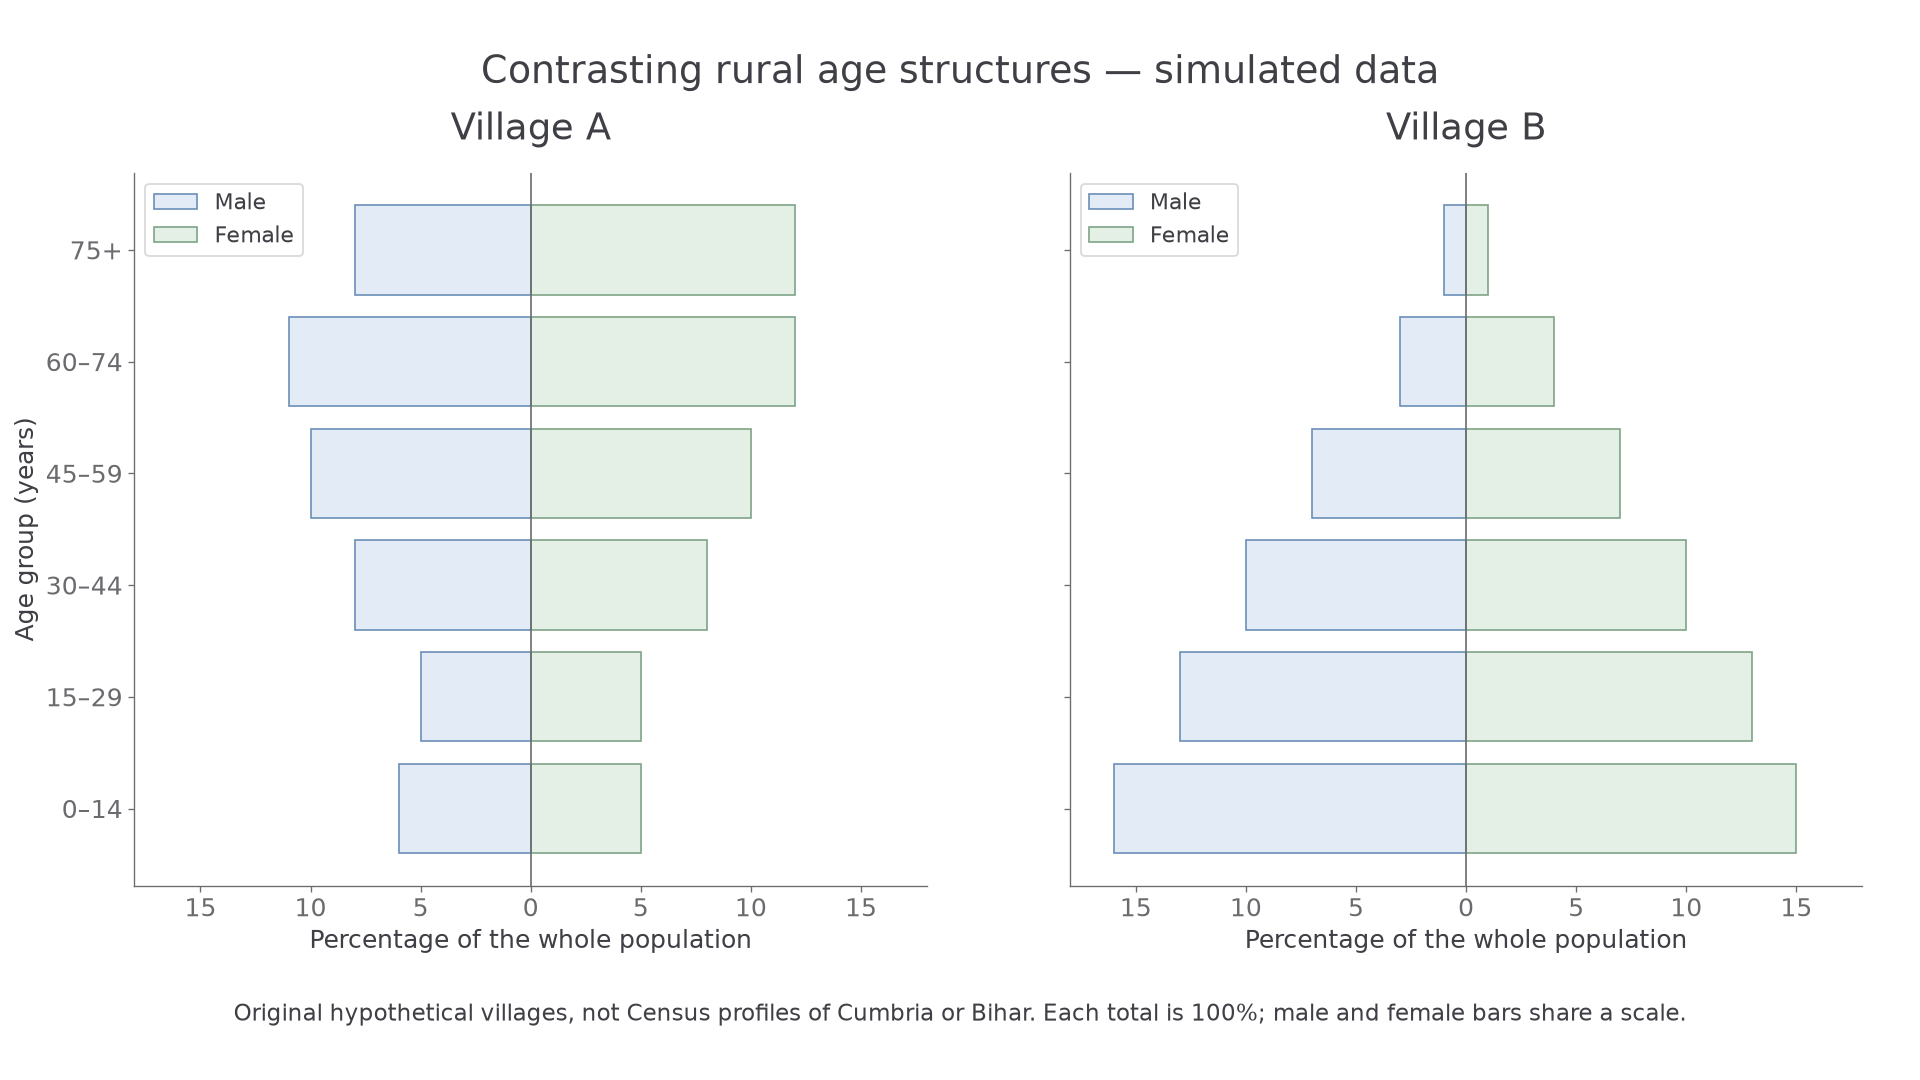
Original hypothetical villages, not census profiles of named places. In Village A the 0–14 group is 6% male plus 5% female, or 11% of the whole population; Village B's equivalent group is 31%.
To construct a pyramid, organise male/female counts into identical age bands, calculate shares using the stated denominator and put youngest ages at the bottom. Use matching horizontal scales on both sides of the zero line; draw equal-height bars for equal age intervals and label the units, date and sexes. In a spreadsheet, negative plotting values can place one sex to the left, but display those population magnitudes as positive values. The open-ended oldest group must be identified rather than treated as another fixed-length age interval. Practise plotting several supplied cohorts and submit a drawing/image when construction itself is assessed.