1.5 - Conducting a correlation practical
Learn to collect paired measurements, construct a scatter diagram, select a correlation test and reflect on a small practical. All worked records are fictional; analysing them does not certify that you have conducted your own correlation.
Two measurements from each person
A correlation asks whether two measured variables vary together, without manipulating one to produce the other.
Our original practical asks: Is leisure-reading time associated with enjoyment of leisure reading in adult library users? Operationalise variable one as self-reported minutes spent reading for leisure during the previous day, excluding work or compulsory study. Operationalise variable two as a rating of usual enjoyment of leisure reading, from 1 “Not at all enjoyable” to 7 “Extremely enjoyable”. Use a separate “Prefer not to answer” option, not a score of zero. Time is numerical with a meaningful zero, while the rating is ordinal; the difference between ratings 2 and 3 need not mean the same enjoyment change as the difference between 5 and 6.
The non-directional alternative predicts an association between those two operationalised measures. The null predicts no association in the population. A directional prediction would specify positive or negative association before examining data. There is no manipulated IV here; calling reading time an IV can misleadingly imply experimental control.
With institutional approval, invite ten available consenting adult library users during an agreed session. State that this is opportunity sampling, define the target population and report the actual usable sample. Enthusiastic readers may be overrepresented among visitors or willing respondents; a narrow enjoyment range can conceal relationships found in a broader population. Recruiting more people from the same narrow source does not automatically remove this bias.
Each row must contain the two scores from the same person. If participant P03 reports 20 minutes and enjoyment 5, keep (20, 5) together throughout collection, sorting and analysis. Pairing someone else's enjoyment score with P03's minutes destroys the question being tested. A method of collection and an analytical relationship are different: this correlation uses self-report to obtain its two measurements.
Consistent questions and a pilot
Standardised questions improve comparability without making imperfect self-reports objectively exact.
Prepare a participant information/consent sheet, one brief form, a code list stored separately if needed, a debrief and an approved spreadsheet. The first question reads: “Approximately how many minutes did you spend reading for leisure yesterday? Include books, magazines or non-work articles on paper or a screen; exclude work and compulsory study. Enter 0 if none.” The second reads: “How enjoyable do you usually find leisure reading?” with all seven ordered ratings and their endpoints displayed. Define whether listening to an audiobook is included; this protocol excludes it because the aim concerns reading. Ask the same questions in the same order, in a quiet agreed location, without praising high time or high enjoyment.
Pilot with two eligible volunteers excluded from the main sample. Ask whether the examples are clear and whether “yesterday” can be estimated. If one person includes studying and another excludes it, revise the instructions. Use the final version for every main participant, allow private completion and do not pressure a person to invent a time. Record omission as missing; a zero-minute answer is valid data. Only use complete usable pairs for the paired analysis and report how many were excluded for missing one measure.
Recall estimates may be inaccurate, and a single previous day may not represent usual behaviour, while the enjoyment question asks about usual experience. This mismatch limits construct validity. A future protocol could use a seven-day reading diary with a daily definition and average the recorded minutes, then ask about enjoyment over the same week. That improvement adds respondent burden and can still miss or alter behaviour; pilot it rather than assuming it solves all error.
Safe participation and intact pairs
Risk management protects participants and prevents record handling from corrupting the paired data.
Obtain supervisor approval and meet the institution's employer requirements before conduct. The risk assessment records hazards, affected people, controls, residual risk and stopping actions. Possible pressure to look studious is a psychological/social risk: explain that the task is not an academic judgement and low reading time is acceptable. Participation is voluntary, questions can be omitted and access to services does not depend on cooperating. Follow the institution's consent requirements and recruit only people able to understand the information. Stop if someone becomes uncomfortable rather than insisting on a complete pair.
Collect no names, email addresses or unnecessary demographic details. Give a random withdrawal code and explain a deadline before irreversible anonymisation. Keep any consent records separately, restrict access and use the approved deletion plan. Debrief that an association cannot identify which variable causes the other. Use an uncluttered approved location and safely positioned equipment; low physical risk does not eliminate privacy or pressure risks.
Enter one participant per row with code, minutes, enjoyment and missing-status columns. Validate nonnegative minutes and ratings from 1 to 7, while retaining missing as missing. Check rows against originals and preserve a read-only export. When sorting, select the whole table: sorting the minutes column alone would re-pair the data incorrectly. A spreadsheet scatter tool should use minutes as x and enjoyment as y, not participant codes as an axis. Restrict access to the institution-approved file and check whether a digital form collects identifiers automatically. If collection is shared, record which steps you performed and how pooled rows were checked.
Constructing and interpreting a scatter diagram
A scatter diagram plots each complete pair once so the direction and form of the observed relationship can be inspected.
Use this fictional demonstration, which has six people rather than the planned ten:
| Participant | Previous-day reading time (minutes) | Enjoyment rating (1–7) |
|---|---|---|
| P01 | 5 | 2 |
| P02 | 10 | 3 |
| P03 | 15 | 3 |
| P04 | 20 | 5 |
| P05 | 25 | 4 |
| P06 | 30 | 6 |
To construct the graph in a notebook, draw a horizontal axis labelled “Previous-day leisure reading (minutes)” from 0 to 35 in equal five-minute steps. Draw a vertical axis labelled “Usual reading enjoyment (1–7)” from 1 to 7 in equal one-point steps. Plot (5, 2), (10, 3), (15, 3), (20, 5), (25, 4) and (30, 6). Check each dot against its row, count six dots and give a title identifying the illustrative sample. Do not join consecutive people with lines; their order in the table is not a time sequence. A line of best fit is optional for showing a trend, not a substitute for plotting the pairs.
[DIAGRAM: asset_slug: rm32_reading_scatter; file: rm32_reading_scatter.png; description: Six paired illustrative observations showing a broadly positive association between previous-day reading minutes and enjoyment ratings, with a lower rating at 25 than at 20 minutes.]
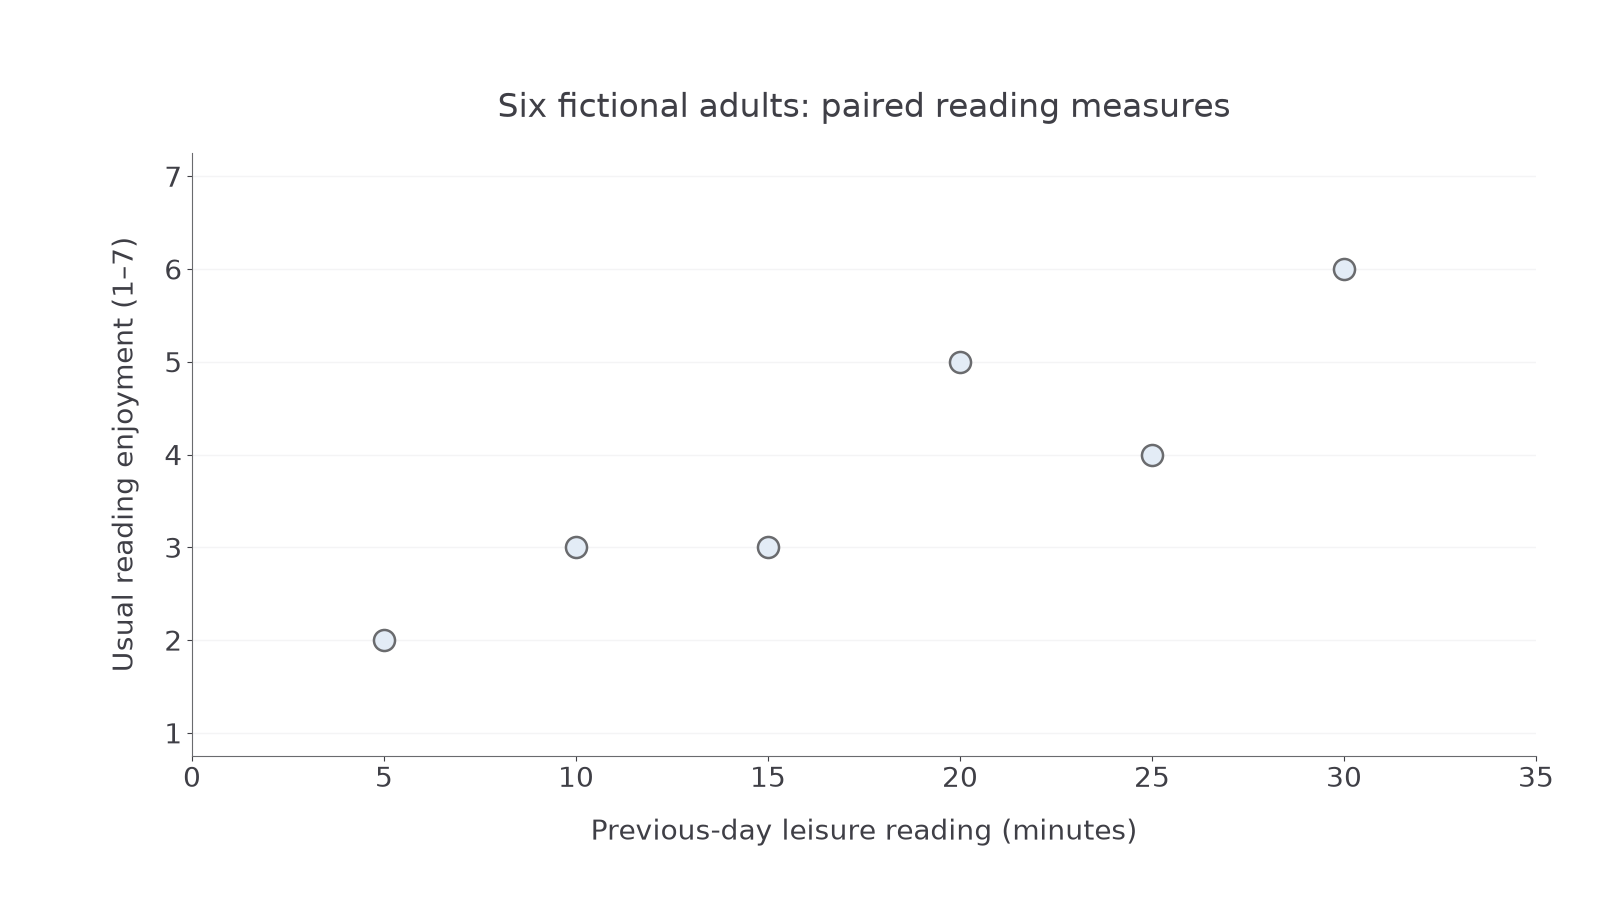
Diagram description: Each dot represents one fictional person's two measures; the rating scale is ordinal and the trend is not perfect.
The points tend upward: greater reported reading time is associated with higher reported enjoyment in this sample. P05 shows that the pattern is not strictly increasing. Do not assign a precise correlation coefficient merely by looking at the slope: axis scaling changes slope but not rank order, and strength concerns how closely points follow a relationship. Two people sharing enjoyment 3 form a tie; both are retained.
Spearman's rho is suitable for testing an association in these paired rankable measures because enjoyment is ordinal. It does not require pretending the rating gaps are equal. Use average ranks for ties in the previously taught procedure; keep raw and ranked records distinct. A relevant table or probability decision must match the sample size, tail and preselected significance level. This example teaches selection and plotting without claiming a calculated coefficient or significance result.
Even a statistically significant association would not demonstrate causation. Enjoyment may encourage reading, more reading may increase enjoyment, or available leisure time may influence both. A shared self-report method can also create correlated reporting biases. Significance is neither the probability that the null is true nor evidence that a relationship is practically large.
An honest report and a better follow-up
A correlation report preserves the association question and evaluates how well the measurements answer it.
Describe recruitment, actual sample, operational definitions, standardised questions, consent and procedure. Results report complete-pair counts, missing data, the labelled scatter diagram and any justified test result. Place blank materials, anonymised paired raw data and workings in appendices. In discussion state direction and appropriate limits, compare evidence with the prediction and distinguish measured association from a causal claim. Do not say “the IV made the DV increase” when neither was manipulated.
Reflection should arise from actual conduct: if respondents asked whether textbook reading counted, record the ambiguity, explain its effect on the time measure, revise examples and re-pilot. If almost everyone chose high enjoyment, explain the restricted range and consider a broader approved recruitment source. Changing to a different sample may improve range while making comparisons with the first sample harder; retain the earlier results honestly. Consistent scripts and paired records support replicability, but consistency cannot repair an invalid enjoyment scale or inaccurate estimates.
Explain your personal practical role and a concrete lesson it supplies for a new research design. In written simulation, attribute an incident to the fictional log instead of claiming it happened to you. Real required conduct includes recruiting/collecting safely, plotting and analysing real records, and reflecting on experience under appropriate supervision.