1.1 - Correlations and their limits
Correlational analysis asks whether two measured variables vary together. Learn how to collect paired scores, construct and read a scatter diagram, and explain why a relationship alone does not establish a cause.
Collecting paired measurements
A correlation investigates an association between two variables measured for the same cases.
For a study of practice and learning, each participant could report their number of revision sessions in the past week and complete the same ten-question quiz. Each person contributes a pair: sessions and quiz score. The pairs must remain linked. Rearranging one column independently would destroy the relationship between each person's two measurements.
Researchers do not deliberately create conditions of the two variables in a correlational study. It is clearer to call them co-variables or variables 1 and 2, rather than assume an experimental IV and DV. A questionnaire, test, observation or existing record can supply a measurement. Correlation describes the relationship analysed; it does not tell you which data-collection technique was used.
Define both measures precisely and use the same method for every participant. “Revision sessions in the past week” still needs a rule for what counts as a session; “at least 20 uninterrupted minutes spent revising” is more reproducible. Quiz score is the number correct out of ten. Self-reported sessions may be forgotten or exaggerated, and a short quiz may not capture all learning. The quality of the relationship depends on the quality and range of the measures.
These original illustrative scores will be used in the worked scatter diagram; they are not findings from a published study.
| Participant | Revision sessions in past week | Quiz score out of 10 |
|---|---|---|
| A | 1 | 2 |
| B | 2 | 3 |
| C | 3 | 3 |
| D | 4 | 5 |
| E | 5 | 6 |
| F | 6 | 7 |
Constructing a scatter diagram
A scatter diagram places each paired measurement as one point on two numerical axes.
For the worked data, place revision sessions on the horizontal axis and quiz score on the vertical axis. Label each axis with its full measure and units where appropriate; “quiz score out of 10” states the scale. Choose evenly spaced numerical intervals that cover the data. A horizontal scale from 0 to 6 and a vertical scale from 0 to 10 each use increments of one. Equal distances must represent equal numerical changes.
Plot A at , B at , C at , D at , E at and F at . Locate the horizontal value first, then the vertical value. There are six pairs and six distinct points here. In another dataset, identical pairs could overlap, so the number of visible dots need not always equal the number of participants.
Give the chart a title identifying the relationship. Do not join consecutive participants' points: the order of participants is not a time sequence, and connecting them would imply a path that the measurements do not describe. A line of best fit, if appropriate, represents an overall tendency rather than a line through every point; it is not needed simply to identify the direction.
[DIAGRAM: asset_slug: rm04-scatter-patterns; file: rm04-scatter-patterns.png; description: Three exact plots of original illustrative paired measurements: revision sessions and quiz scores rising overall, worry rating and sleep hours falling, and session counts and quiz scores with no overall linear trend. Axes and each of the six points are labelled by the stated scales.]
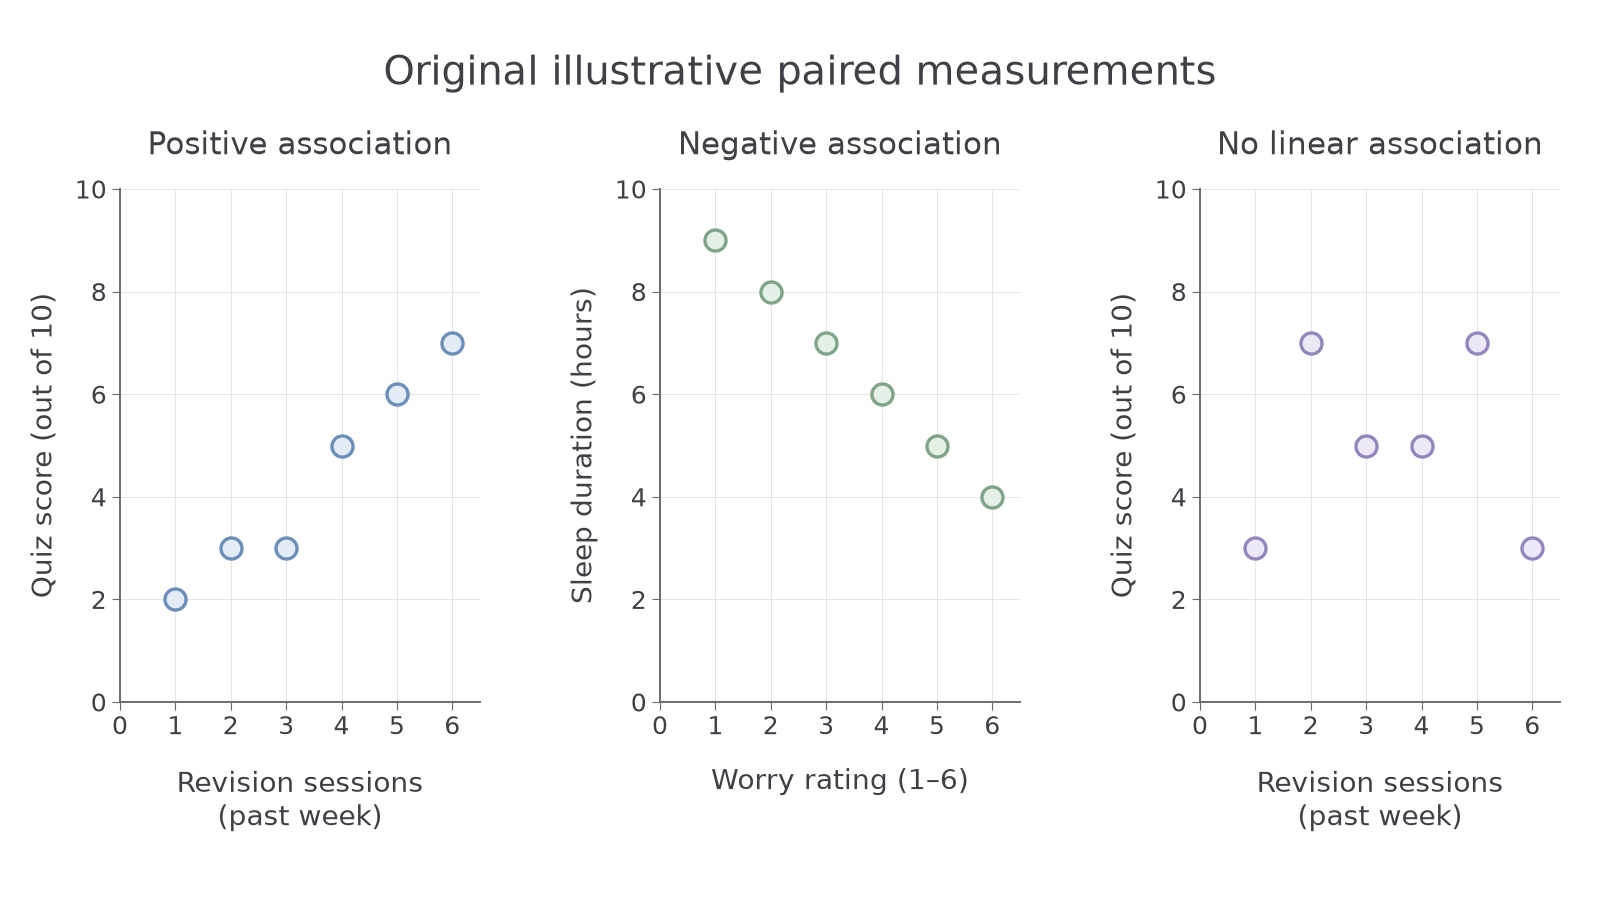
Diagram description: Each point represents one pair of measurements. The left panel plots the worked revision data; the other panels illustrate different patterns using original teaching data.
To practise construction in a notebook, reproduce the left panel from the table before comparing it with the supplied plot. Check the labels, equal intervals and all six coordinates. This is construction practice; a written check here does not certify a submitted drawing.
Direction and strength of relationships
The overall pattern of a scatter diagram shows the direction and approximate strength of an association.
In a positive correlation, higher values of one variable tend to accompany higher values of the other. The left panel rises overall: participants with more revision sessions generally have higher quiz scores. B and C have the same quiz score despite different session counts; positive correlation is a tendency, not a claim that every increase must accompany an increase in every individual.
In a negative correlation, higher values of one variable tend to accompany lower values of the other. The middle panel uses worry ratings 1, 2, 3, 4, 5 and 6 paired with sleep durations 9, 8, 7, 6, 5 and 4 hours. Its downward pattern is negative. “Negative” describes direction; it does not mean a weak, harmful or undesirable relationship.
No correlation, in the usual linear reading, means no overall upward or downward tendency. The right panel pairs session counts 1–6 with quiz scores 3, 7, 5, 5, 7 and 3. Higher session counts do not consistently accompany higher or lower scores. No linear relationship does not rule out a curved relationship or a relationship in a different population or range of values.
Strength concerns how closely the points follow a relationship. A tight downward pattern can be stronger than a scattered upward pattern; direction and strength are separate. An isolated outlier can change the apparent relationship, so inspect the whole plot rather than one pair. A numerical correlation coefficient can quantify linear association, but its calculation and statistical testing are taught later.
Uses and causal limits
Correlation can identify useful relationships without showing that one variable caused the other.
It allows researchers to investigate variables that would be unethical or impractical to manipulate, such as naturally experienced stress and sleep. Associated measures can help prediction within the population and range actually studied. An observed revision–quiz association may also motivate a later controlled experiment on a revision strategy. Measuring existing variables avoids that particular manipulation, but the measurements can still be intrusive or distressing and require ethical safeguards.
Two causal problems remain. First, directionality: more revision might improve quiz performance, but people who already understand the subject might be more motivated to revise. Second, a third variable might affect both. Previous subject interest could encourage revision and improve quiz scores. Measuring both variables at the same time does not separate these explanations.
Therefore, “students with more sessions tended to score higher” is justified by the illustrative left panel; “extra sessions caused the higher scores” is not. A large or strong correlation does not remove directionality or third-variable explanations. It also does not guarantee useful prediction for a person far outside the measured range.
The method's strength and weakness can be linked to the same question. Observing existing revision habits avoids forcing students to revise less, while the absence of manipulation and control leaves other explanations. Improving measurement, collecting a wider relevant range and measuring plausible third variables can improve evidence, but simply adding more participants does not convert correlation into an experiment.