3.9.1 - Scale, synergy and overtrading
Growing sales can create cost advantages while placing pressure on coordination and cash. This lesson distinguishes economies of scale, economies of scope and synergy, then explains how diseconomies and overtrading can prevent growth from improving performance.
Scale and unit-cost advantages
Economies of scale occur when a larger scale of operation allows the business to reduce its average cost per unit.
Average cost
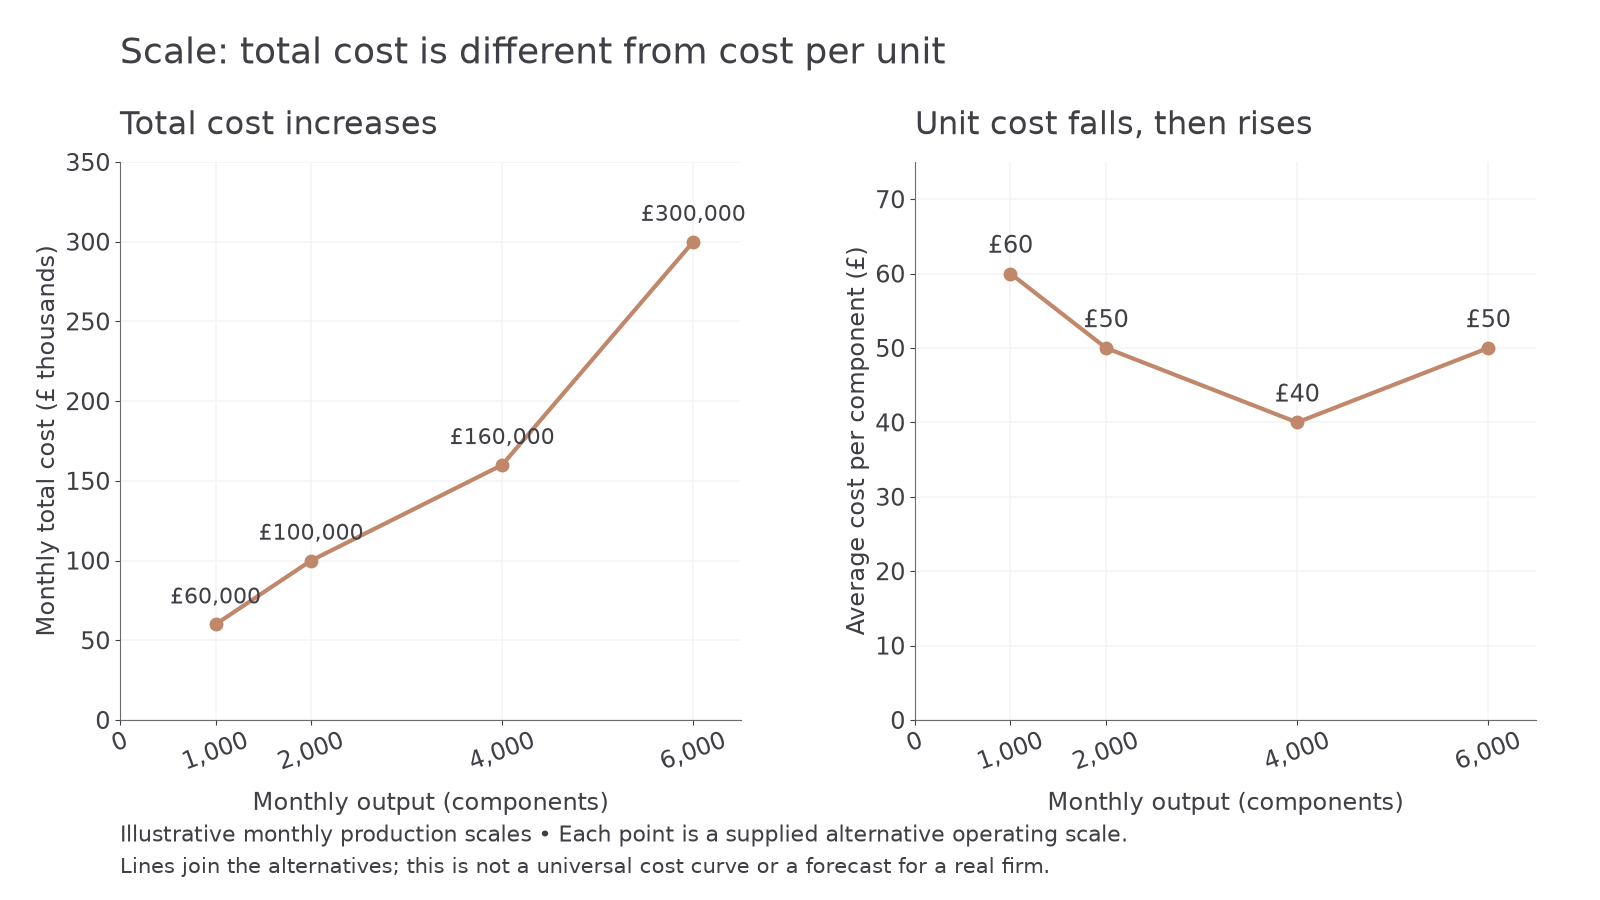
Total cost can rise while average cost falls. The table compares a component manufacturer's costs at different production scales. Each row represents an alternative operating scale with suitable capacity, not merely another busy day in the same unchanged factory.
| Monthly output | Monthly total cost | Average cost per component |
|---|---|---|
| 1,000 | £60,000 | £60 |
| 2,000 | £100,000 | £50 |
| 4,000 | £160,000 | £40 |
| 6,000 | £300,000 | £50 |
From 1,000 to 4,000 components, total cost rises but output rises proportionately more, lowering average cost. The final row shows that further expansion need not continue the saving; coordination problems can outweigh advantages. These alternative scales show how costs could change for this manufacturer without establishing an efficient size for every producer.
Worked example 1 - comparing two scales
Worked example 2 - rising cost after further expansion
Output is 50% higher, but total cost is 87.5% higher. Larger size is therefore not enough to secure a lower average cost.
The LEGO Group opened a US$1 billion factory in Vietnam on 9 April 2025, its sixth factory worldwide and second in Asia. Such a large capacity investment can support production and distribution at scale, but a large site is not proof of a unit-cost saving: utilisation, transport, skills and coordination determine whether that opportunity is achieved. LEGO Group, 2025.
[DIAGRAM: asset_name: Total cost and average cost at different scales; asset_slug: aqa_b51_scale_costs; caption: Higher total cost can coexist with lower unit cost, and an additional expansion can reverse the unit-cost saving.; description: Two panels compare monthly output levels of 1,000, 2,000, 4,000 and 6,000 components. Total costs are £60,000, £100,000, £160,000 and £300,000. Average costs are £60, £50, £40 and £50 per component. Lines join supplied alternatives and do not claim a universal cost curve.]
Technical economies arise from equipment or production methods that become efficient at a sufficiently large scale. A high-capacity machine may reduce waste and processing time, while its purchase cost is spread over more units. If demand is insufficient to keep it used, the expected saving may not appear. Growth provides an opportunity to use the technology, not a guaranteed reduction in cost.
Purchasing economies arise when larger or more regular orders secure a lower input price. A supplier may offer favourable terms because a large order reduces its selling and delivery effort. The saving lowers material cost per unit. It can be offset by storing surplus stock, waste or dependence on one supplier, so buying extra unwanted material is not automatically efficient.
Managerial economies arise when scale supports specialist managers whose knowledge improves decisions. A purchasing specialist may negotiate better contracts, while a production manager can reduce idle time. Their salaries are spread across enough output to justify them. Adding managers without effective improvements increases cost rather than creating an economy.
Economies of scope and synergy
Combining activities can improve performance through shared resources even where the output of one product does not increase.
Economies of scope occur when producing a range of products together costs less than producing them separately, because resources can be shared. Producing bread and pastries in one bakery can allow both ranges to share premises, deliveries and some equipment. If separate businesses would each need those resources, combined provision can reduce total costs for the range. More variety can also create extra cleaning, scheduling and stock complexity, so scope economies depend on a genuine sharing advantage.
Scope concerns the range of activities; scale concerns size or output. Producing more bread using a larger efficient oven is a scale example. Producing bread and pastries using shared delivery capacity is a scope example. A business can gain both at once, but identifying the source of the saving improves the analysis.
Synergy occurs when combining resources produces a greater benefit than the activities would achieve separately. It can include cost savings, improved sales or new capability. An equipment producer working with a software business could combine a machine and compatible monitoring tools into a system more useful than either business's separate offer. Scope economies are one possible source of synergy, but synergy is the broader combined-performance idea.
Claims about synergy need evidence. Suppose two separate businesses forecast annual profits of £200,000 and £150,000. A combined operation forecasts £420,000 after recurring coordination costs, suggesting £70,000 more than the £350,000 separate total. That extra performance is a forecast, not a realised gain. Any acquisition premium and one-off integration costs also need consideration before concluding that the combination creates value for the buyer.
Worked example 1 - the forecast extra profit
Worked example 2 - subtracting recurring integration costs
Two businesses forecast £125,000 and £95,000 separately. Their combination forecasts £285,000 before additional recurring coordination costs of £40,000.
Comparing the unadjusted £285,000 with the separate total would exaggerate the gain. One-off purchase and integration costs still need separate appraisal.
Continue this lesson.
You’re previewing NovaLearn without an account. Create a free account to read the rest.
Create free account